. 2010 Jun 11:11:370.
doi: 10.1186/1471-2164-11-370.

Transcription profiling provides insights into gene pathways involved in horn and scurs development in cattle

Affiliations

Transcription profiling provides insights into gene pathways involved in horn and scurs development in cattle

Maxy Mariasegaram et al. BMC Genomics. .

Abstract

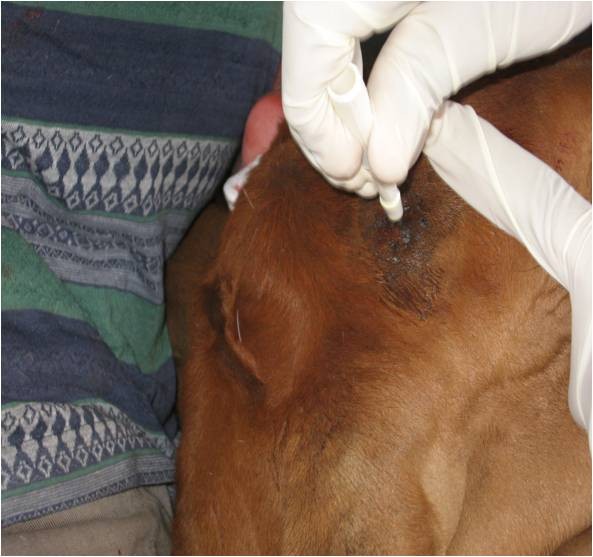
Background: Two types of horns are evident in cattle - fixed horns attached to the skull and a variation called scurs, which refers to small loosely attached horns. Cattle lacking horns are referred to as polled. Although both the Poll and Scurs loci have been mapped to BTA1 and 19 respectively, the underlying genetic basis of these phenotypes is unknown, and so far, no candidate genes regulating these developmental processes have been described. This study is the first reported attempt at transcript profiling to identify genes and pathways contributing to horn and scurs development in Brahman cattle, relative to polled counterparts.

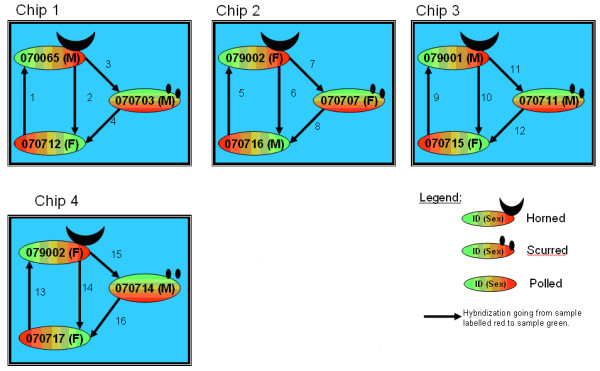
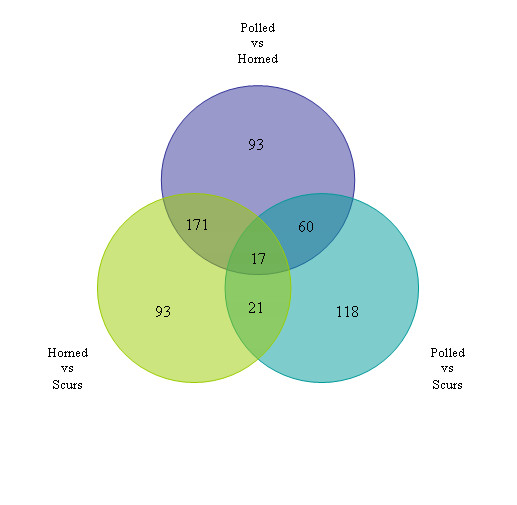
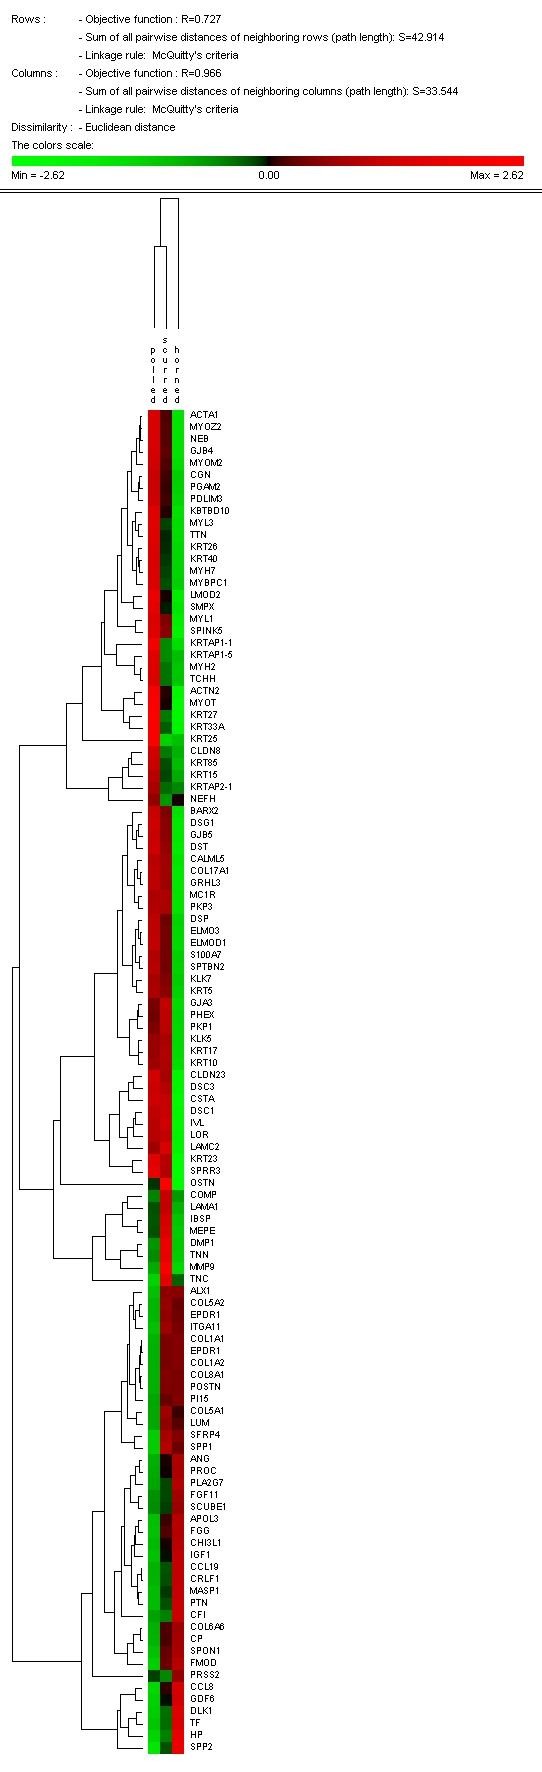
Results: Expression patterns in polled, horned and scurs tissues were obtained using the Agilent 44 k bovine array. The most notable feature when comparing transcriptional profiles of developing horn tissues against polled was the down regulation of genes coding for elements of the cadherin junction as well as those involved in epidermal development. We hypothesize this as a key event involved in keratinocyte migration and subsequent horn development. In the polled-scurs comparison, the most prevalent differentially expressed transcripts code for genes involved in extracellular matrix remodelling, which were up regulated in scurs tissues relative to polled.

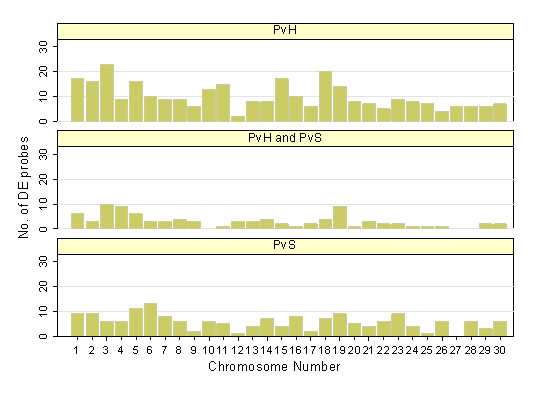
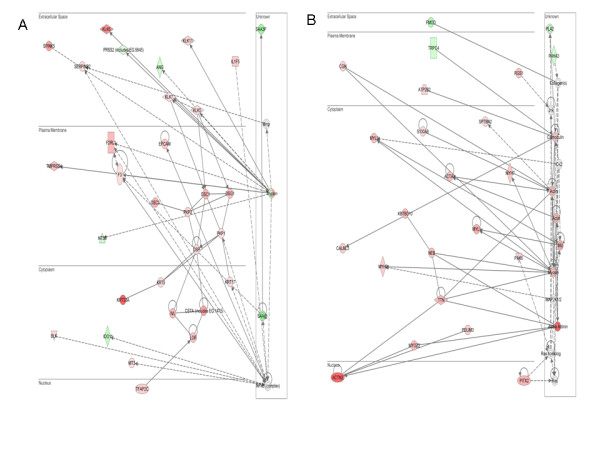
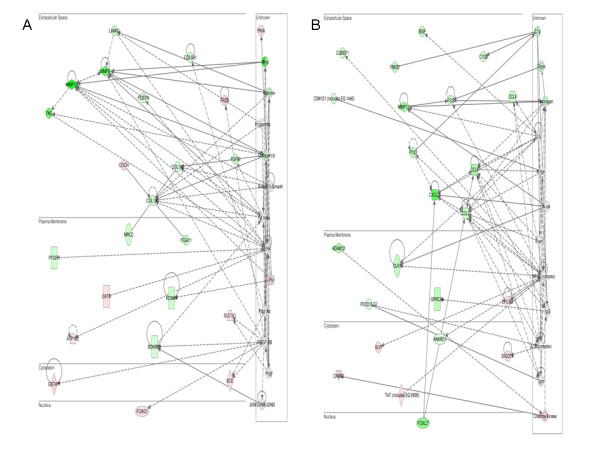
Conclusion: For this first time we describe networks of genes involved in horn and scurs development. Interestingly, we did not observe differential expression in any of the genes present on the fine mapped region of BTA1 known to contain the Poll locus.


Figures

Figure 1
Figure 1
Tissue sampling from the horn-forming region on the skull using a 3 mm biopsy punch. The prospective horn-forming region is not apparent always. It was assessed in similar age calves with apparent signs of horn development such as keratinised skin without hair growth or horn bud appearance. Based on these initial observations, the prospective horn region was located in calves with no obvious signs by drawing lines from eye and ear upwards and where they cross each other on both sides of the poll.
Figure 2
Figure 2
Experimental design
Figure 3
Figure 3
Summary of the 573 differentially expressed genes between the three contrasts of interest i.e. Polled versus Horned (PvH), Polled versus Scurs (PvS) and Horn versus Scurs (HvS)
Figure 4
Figure 4
Distribution of probes on the bovine chromosome (Btau4.0) that were differentially expressed in the Poll Polled versus Horned (PvH) contrast, Polled versus Scurs (PvS) and those that were common to both. The horizontal axis represents the chromosomal location. Note that number 30 represents the X chromosome.
Figure 5
Figure 5
Genes in overrepresented functional annotation clusters from DAVID analysis were clustered according to their relative gene expression values, using PermutMatrix hierachical clustering software. Each gene is represented by a single row of coloured boxes; each phenotype is represented by a single column. As shown on the legend, up-regulated genes are indicated with red of increasing intensity and down regulated genes indicated by green of increasing intensity.
Figure 6
Figure 6
Top two IPA networks from analysis of all genes differentially expressed in PvH. The red shading indicates genes that show decreased expression in horned animals versus polled individuals while green is a measure of up-regulation in polled versus horned. The colour intensity is proportional to the level of up- or down-regulation. (A) is the network of genes involved in hair and skin development. (B) Skeletal and muscular system development and function and tissue morphology.
Figure 7
Figure 7
Top two IPA networks from analysis of all genes differentially expressed in PvS. Comparisons are with respect to polled animals, consequently the more intense green or red indicate greater up- or down-regulation of the respective genes. (A) Connective tissue development and function/skeletal and muscular system development and function/tissue development. (B) Cellular movement/haematological system development/immune cell trafficking.

References

    1. Long CR, Gregory KE. Inheritance of the horned, scurred and polled condition in cattle. Journal of Heredity. 1978;69(6):395–400.
    1. Georges M, Drinkwater R, King T, Mishra A, Moore SS, Nielsen D, Sargeant LS, Sorensen A, Steele MR, Zhao XY. et al.Microsatellite mapping of a gene affecting horn development in Bos-taurus. Nature Genet. 1993;4(2):206–210. doi: 10.1038/ng0693-206. - DOI - PubMed
    1. Brockmann GA, Martin J, Teuscher F, Schwerin M. Marker controlled inheritance of the polled locus in Simmental cattle. Archiv Fur Tierzucht-Archives of Animal Breeding. 2000;43(3):207–212.
    1. Harlizius B, Tammen I, Eichler K, Eggen A, Hetzel DJS. New markers on bovine chromosome 1 are closely linked to the polled gene in Simmental and Pinzgauer cattle. Mamm Genome. 1997;8(4):255–257. doi: 10.1007/s003359900404. - DOI - PubMed
    1. Brenneman RA, Davis SK, Sanders JO, Burns BM, Wheeler TC, Turner JW, Taylor JF. The polled locus maps to BTA1 in a Bos indicus × Bos taurus cross. Journal of Heredity. 1996;87(2):156–161. - PubMed

Publication types

LinkOut - more resources