. 2010 Sep;31(25):6425-35.
doi: 10.1016/j.biomaterials.2010.04.064.

The differential regulation of cell motile activity through matrix stiffness and porosity in three dimensional collagen matrices

Affiliations

The differential regulation of cell motile activity through matrix stiffness and porosity in three dimensional collagen matrices

Miguel Miron-Mendoza et al. Biomaterials. 2010 Sep.

Abstract

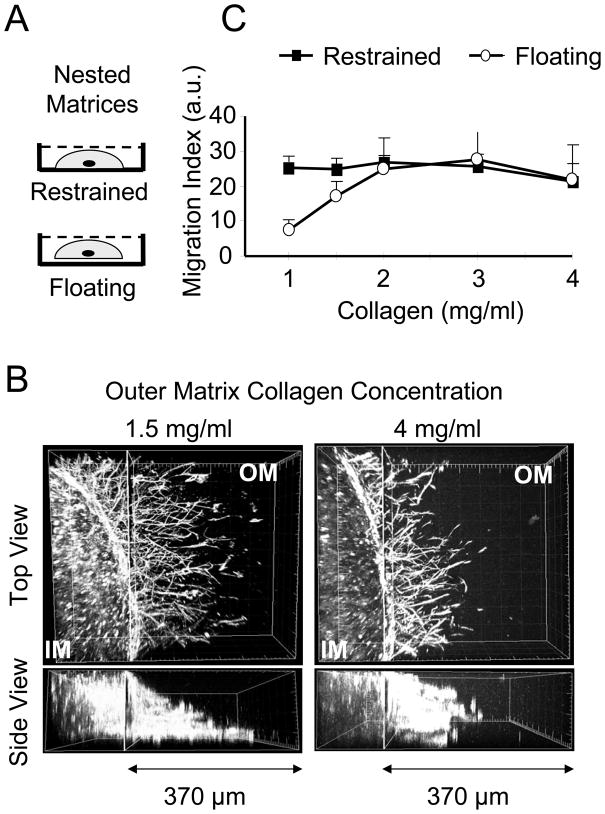
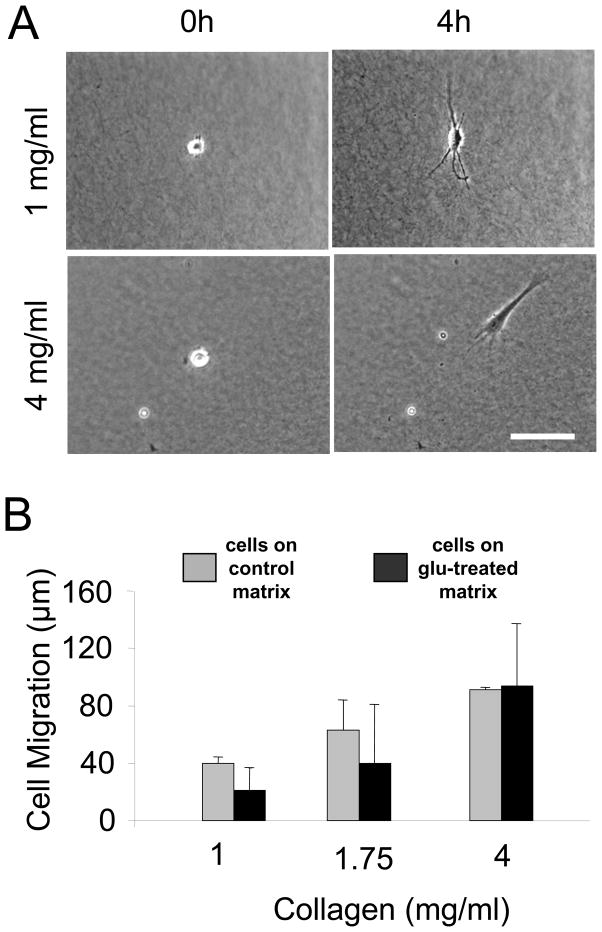
In three dimensional collagen matrices, cell motile activity results in collagen translocation, cell spreading and cell migration. Cells can penetrate into the matrix as well as spread and migrate along its surface. In the current studies, we quantitatively characterize collagen translocation, cell spreading and cell migration in relationship to collagen matrix stiffness and porosity. Collagen matrices prepared with 1-4 mg/ml collagen exhibited matrix stiffness (storage modulus measured by oscillating rheometry) increasing from 4 to 60 Pa and matrix porosity (measured by scanning electron microscopy) decreasing from 4 to 1 microm(2). Over this collagen concentration range, the consequences of cell motile activity changed markedly. As collagen concentration increased, cells no longer were able to cause translocation of collagen fibrils. Cell migration increased and cell spreading changed from dendritic to more flattened and polarized morphology depending on location of cells within or on the surface of the matrix. Collagen translocation appeared to depend primarily on matrix stiffness, whereas cell spreading and migration were less dependent on matrix stiffness and more dependent on collagen matrix porosity.


Figures

Figure 1
Figure 1. Fibroblast migration in nested collagen matrices prepared with 1 to 4 mg/ml collagen outer matrices
(A) Diagram of nested collagen matrices showing cell containing inner matrix within cell free outer matrix and nested matrices restrained on culture dishes or floating in medium. (B) Restrained nested matrices were incubated 24 h. 3D reconstruction shows pattern of cell migration from the inner matrix (IM) to the outer matrix (OM) with 1.5 and 4 mg/ml outer collagen concentrations. With 1.5 mg/ml outer matrices, the density of migrating cells was higher in regions closer to the underlying culture surface. If the concentration of collagen in the outer matrix was increased to 4 mg/ml, then the distribution of migrating cells was more uniform. (C) Restrained and floating nested matrices were prepared using the outer collagen concentrations indicated and incubated 24 h after which cell migration index was determined. Data shown are the averages +/− SD of cell migration index based on three separate experiments with duplicate matrices at each collagen concentration. In floating nested matrices, cell migration index increased as the outer collagen concentration increased. In restrained nested matrices, cell migration index was similar over the range of outer collagen concentrations tested.
Figure 2
Figure 2. Collagen translocation in nested collagen matrices prepared with 1 to 4 mg/ml collagen outer matrices
(A) Floating nested matrices were incubated 24 h. Distribution of 6 μm fluorescent microspheres was visualized at the interface between inner and outer matrices. Bar = 200 μm. (B) Bead density at the interface was quantified using Image J software, and the extent of collagen translocation determined as bead # relative to starting conditions. Data shown are averages +/− SD based on two separate experiments with duplicate matrices for each collagen concentration. As the collagen density increased, collagen translocation decreased.
Figure 3
Figure 3. Quantitative measurements of porosity and stiffness of collagen matrices varying from 1 to 4 mg/ml collagen
Collagen matrices prepared at the collagen concentrations indicated were polymerized 1 h. (A) Samples that were fixed, critical point dried, and palladium coated were imaged by scanning electron microscopy. Bar = 5 μm. (B) Fibril spacing was quantified by measuring matrix poor size. Data shown are the averages +/− SD based on two separate experiments with duplicate matrices at each collagen concentration. (C) Freshly polymerized samples were used to measure matrix stiffness (storage modulus) by oscillating rheometry. Data shown are the averages +/− SD based on two separate experiments with triplicate matrices at each collagen concentration. Increasing the collagen concentration resulted in decreased matrix porosity and increased matrix stiffness.
Figure 4
Figure 4. Motile activity of fibroblasts within and on top of collagen matrices
Phase-contrast images showing initial and final frames from time-lapse videos of fibroblasts incubated for 4 h (A) within (Supplemental time-lapse videos 1 and 2) and (B) on top of (Supplemental time-lapse videos 3 and 4) 1 and 4 mg/ml collagen matrices. Polystyrene beads (6 μm) added to the matrices were used to quantify collagen translocation. Bar = 100 μm. Cell spreading was dendritic within or on the surfaces of 1 mg/ml matrices. With 4 mg/ml matrices, cell spreading was dendritic within matrices but flattened and polarized on the surfaces of matrices, and cells on the surfaces of matrices began to migration.
Figure 5
Figure 5. Collagen translocation and cell spreading of fibroblasts within and on top of collagen matrices
(A) Analysis of collagen translocation from time-lapse videos (Figure 4) as a function of collagen concentration based on displacement of 6 μm beads within the matrices. Data shown are the averages +/− SD based on three separate experiments. As the collagen density increased, collagen translocation decreased. (B & C) Fibroblasts were incubated 4 h within or on top of collagen matrices. At the end of the incubations, the cells were fixed and visualized by immunostaining for actin (c.f. Figure 6). Cell spreading (projected surface area) and cell shape (dendritic index) were determined by morphometric analysis. Data shown are the averages +/− SD of three separate experiments with five cells at each collagen concentration in each experiment. As collagen concentration increased, the extent of cell spreading increased. Fibroblasts on top of matrices became more spread than cells within. Dendritic index was relatively constant for cells within matrices, but decreased as a function of collagen concentration for cells on top of matrices.
Figure 6
Figure 6. Actin stress fibers, focal adhesions, and focal adhesion kinase (FAK) Y397 phosphorylation by fibroblasts on top of collagen matrices
(A) Fibroblasts were incubated 4 h on top of collagen matrices prepared at the collagen concentrations indicated. At the end of the incubations, cells were fixed and visualized by immunostaining for actin and vinculin. As the collagen concentration increased, cell morphology switched from dendritic to flattened and polarized. Actin stress fibers (phalloidin staining) and focal adhesions (vinculin staining) were readily visible in the flattened cell regions. Bar = 50 μm. (B) Fibroblasts were incubated 1 and 4 h on top of collagen matrices prepared with 1 mg/ml collagen (M1) or 4 mg/ml collagen (M4) or on 50 μg/ml collagen-coated coverslips (2D). Cells incubated 1 h on collagen-coated coverslips but not on collagen matrices or trypsinized cells (T) showed FAK phosphorylation. After 4 h, fibroblasts incubated on collagen matrices also showed FAK phosphorylation. Data shown are representative of three independent experiments.
Figure 7
Figure 7. Cell spreading on collagen matrices stiffened chemically by treatment with glutaraldehyde
(A) Collagen matrices prepared with the collagen concentrations indicated were polymerized 1 h and then subjected to glutaraldehye (glu-treated) or PBS (control) treatment. Matrix stiffness (storage modulus) was measured by oscillating rheometry. Data shown are the averages +/− SD based on two separate experiments with triplicate matrices at each collagen concentration. Glu-treated samples had 5–10 fold increased matrix stiffness. (B&C) Fibroblasts were incubated 4 h on top of glu-treated and control matrices. At the end of the incubations, the cells were fixed and visualized by immunostaining for actin (c.f. Figure 8). Cell spreading (projected surface area) and cell shape (dendritic index) were determined by morphometric analysis. Data shown are the averages +/− SD of three separate experiments with five cells at each collagen concentration. Fibroblast spreading and dendritic index showed similar collagen concentration dependence regardless whether or not the matrices were stiffened by glu-treated.
Figure 8
Figure 8. Cell morphology and actin stress fibers on collagen matrices stiffened chemically by treatment with glutaraldehyde
Fibroblasts were incubated 4 h on top of collagen matrices prepared at the collagen concentrations indicated and treated with or without glutaraldehyde as indicated in Figure 7A. At the end of the incubations, cells were visualized by immunostaining for actin. As the collagen concentration increased, cell morphology switched from dendritic to flattened and polarized and actin stress fibers were visible in the flattened cell regions. Increasing matrix stiffness by glu-treatment had no effect on cell morphological appearance. Bar = 50 μm.
Figure 9
Figure 9. Cell migration on collagen matrices stiffened chemically by treatment with glutaraldehyde
(A) Phase-contrast images showing initial and final frames from time-lapse videos of fibroblasts incubated for 4 h on the surfaces of glu-treated (see Figure 7A) collagen matrices at the collagen concentrations indicated (Supplemental time-lapse videos 5 and 6). Cells on 4 mg/ml but not 1 mg/ml matrices developed flattened, polarized morphology and began to migrate. (B) Same as (A) except cell migration determined by measuring nuclear displacement. Data are the average +/− S.D of three separate experiments with five different cells for each collagen concentration. The extent of cell migration was similar on control and glu-treated matrices.

References

    1. Pedersen JA, Boschetti F, Swartz MA. Effects of extracellular fiber architecture on cell membrane shear stress in a 3D fibrous matrix. J Biomech. 2007;40:1484–92. - PubMed
    1. Langevin HM, Bouffard NA, Badger GJ, Iatridis JC, Howe AK. Dynamic fibroblast cytoskeletal response to subcutaneous tissue stretch ex vivo and in vivo. Am J Physiol Cell Physiol. 2005;288:C747–56. - PubMed
    1. Tomasek JJ, Gabbiani G, Hinz B, Chaponnier C, Brown RA. Myofibroblasts and mechano-regulation of connective tissue remodelling. Nat Rev Mol Cell Biol. 2002;3:349–63. - PubMed
    1. Grinnell F. Fibroblast biology in three-dimensional collagen matrices. Trends Cell Biol. 2003;13:264–9. - PubMed
    1. Fisher GJ, Varani J, Voorhees JJ. Looking older: fibroblast collapse and therapeutic implications. Arch Dermatol. 2008;144:666–72. - PMC - PubMed

Publication types