

myc maintains embryonic stem cell pluripotency and self-renewal
- PMID: 20537458
- PMCID: PMC2916696
- DOI: 10.1016/j.diff.2010.05.001
myc maintains embryonic stem cell pluripotency and self-renewal
Abstract
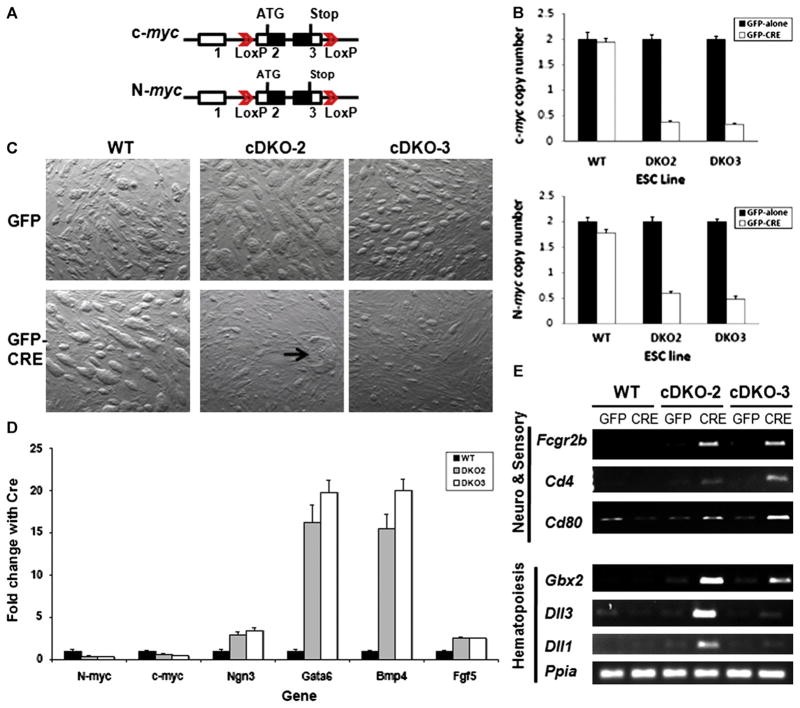
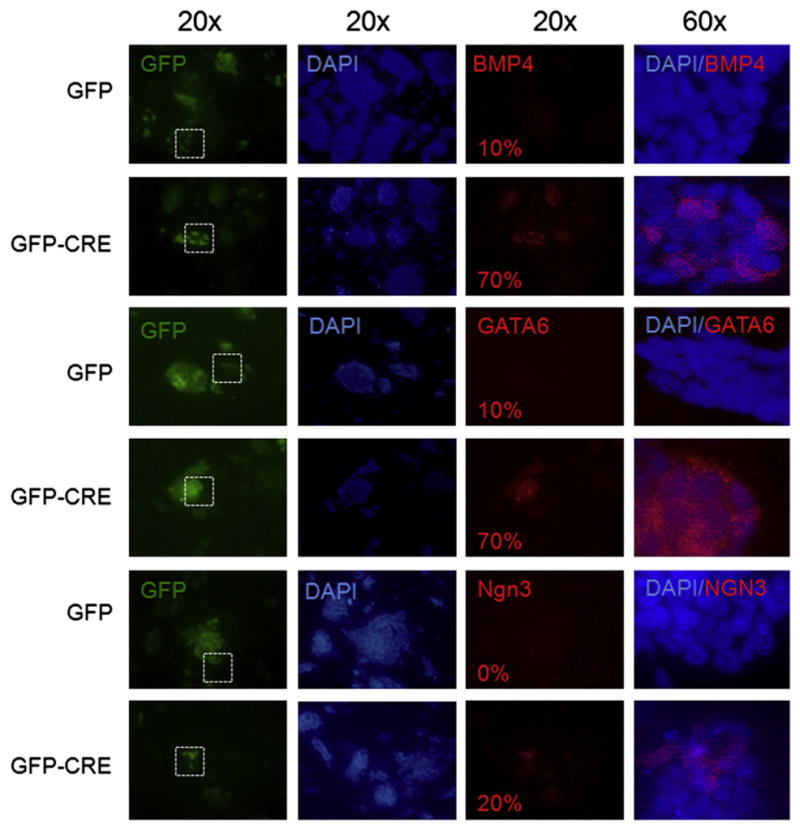
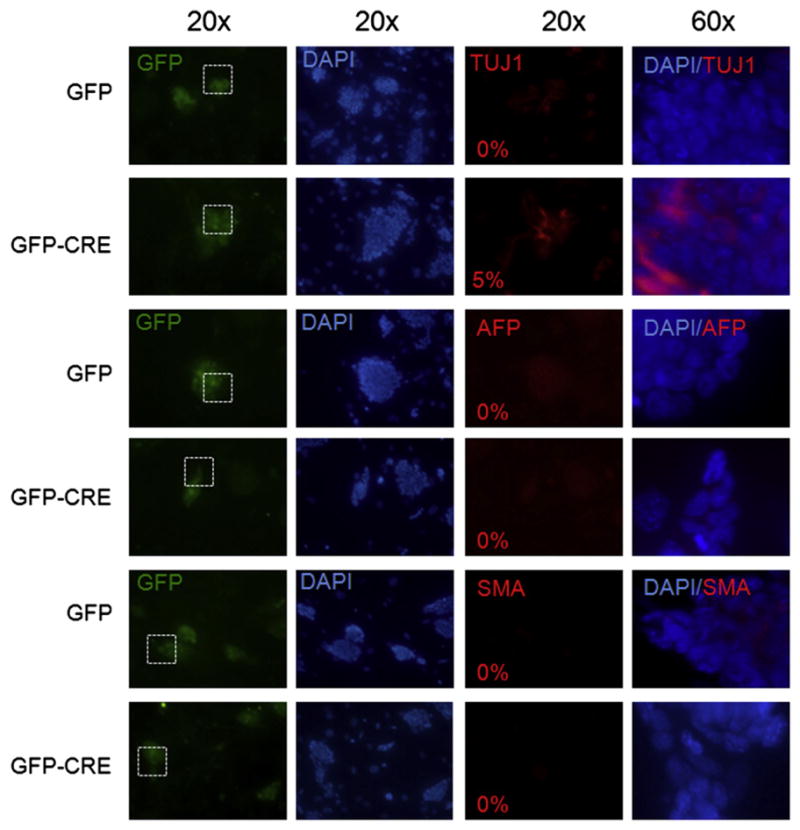
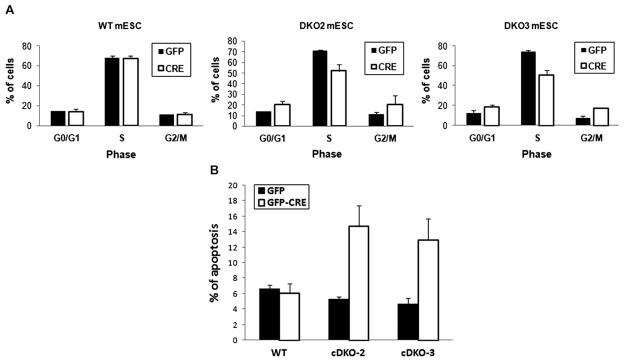
While endogenous Myc (c-myc) and Mycn (N-myc) have been reported to be separately dispensable for murine embryonic stem cell (mESC) function, myc greatly enhances induced pluripotent stem (iPS) cell formation and overexpressed c-myc confers LIF-independence upon mESC. To address the role of myc genes in ESC and in pluripotency generally, we conditionally knocked out both c- and N-myc using myc doubly homozygously floxed mESC lines (cDKO). Both lines of myc cDKO mESC exhibited severely disrupted self-renewal, pluripotency, and survival along with enhanced differentiation. Chimeric embryos injected with DKO mESC most often completely failed to develop or in rare cases survived but with severe defects. The essential nature of myc for self-renewal and pluripotency is at least in part mediated through orchestrating pluripotency-related cell cycle and metabolic programs. This study demonstrates that endogenous myc genes are essential for mESC pluripotency and self-renewal as well as providing the first evidence that myc genes are required for early embryogenesis, suggesting potential mechanisms of myc contribution to iPS cell formation.
Copyright 2010 International Society of Differentiation. Published by Elsevier B.V. All rights reserved.
Figures


Similar articles
-
CIP2A increases self-renewal and is linked to Myc in neural progenitor cells.Differentiation. 2010 Jul;80(1):68-77. doi: 10.1016/j.diff.2010.04.003. Epub 2010 May 5. Differentiation. 2010. PMID: 20447748
-
N-Myc regulates expression of pluripotency genes in neuroblastoma including lif, klf2, klf4, and lin28b.PLoS One. 2009 Jun 4;4(6):e5799. doi: 10.1371/journal.pone.0005799. PLoS One. 2009. PMID: 19495417 Free PMC article.
-
Nac1 promotes self-renewal of embryonic stem cells through direct transcriptional regulation of c-Myc.Oncotarget. 2017 Jul 18;8(29):47607-47618. doi: 10.18632/oncotarget.17744. Oncotarget. 2017. PMID: 28548937 Free PMC article.
-
Why myc? An unexpected ingredient in the stem cell cocktail.Cell Stem Cell. 2008 Jan 10;2(1):18-21. doi: 10.1016/j.stem.2007.12.004. Cell Stem Cell. 2008. PMID: 18371417 Review.
-
Regulatory role of Klf5 in early mouse development and in embryonic stem cells.Vitam Horm. 2011;87:381-97. doi: 10.1016/B978-0-12-386015-6.00037-8. Vitam Horm. 2011. PMID: 22127252 Review.
Cited by
-
Self-renewing endodermal progenitor lines generated from human pluripotent stem cells.Cell Stem Cell. 2012 Apr 6;10(4):371-84. doi: 10.1016/j.stem.2012.02.024. Cell Stem Cell. 2012. PMID: 22482503 Free PMC article.
-
The tumorigenicity of human embryonic and induced pluripotent stem cells.Nat Rev Cancer. 2011 Apr;11(4):268-77. doi: 10.1038/nrc3034. Epub 2011 Mar 10. Nat Rev Cancer. 2011. PMID: 21390058 Review.
-
CDDO and ATRA Instigate Differentiation of IMR32 Human Neuroblastoma Cells.Front Mol Neurosci. 2017 Sep 26;10:310. doi: 10.3389/fnmol.2017.00310. eCollection 2017. Front Mol Neurosci. 2017. PMID: 29018329 Free PMC article.
-
Mechanisms Regulating Stemness and Differentiation in Embryonal Carcinoma Cells.Stem Cells Int. 2017;2017:3684178. doi: 10.1155/2017/3684178. Epub 2017 Mar 8. Stem Cells Int. 2017. PMID: 28373885 Free PMC article. Review.
-
An extended model for culture-dependent heterogenous gene expression and proliferation dynamics in mouse embryonic stem cells.NPJ Syst Biol Appl. 2017 Aug 3;3:19. doi: 10.1038/s41540-017-0020-5. eCollection 2017. NPJ Syst Biol Appl. 2017. PMID: 28794899 Free PMC article.
References
-
- Amanullah A, Liebermann DA, Hoffman B. p53-independent apoptosis associated with c-Myc-mediated block in myeloid cell differentiation. Oncogene. 2000;19:2967–2977. - PubMed
-
- Ambros V. The functions of animal microRNAs. Nature. 2004;431:350–355. - PubMed
-
- Cartwright P, McLean C, Sheppard A, Rivett D, Jones K, Dalton S. LIF/STAT3 controls ES cell self-renewal and pluripotency by a Myc-dependent mechanism. Development. 2005;132:885–896. - PubMed
Publication types
MeSH terms
Substances
Grants and funding
LinkOut - more resources
Full Text Sources
Other Literature Sources
Molecular Biology Databases
