. 2010 Jun 22;20(12):1099-103.
doi: 10.1016/j.cub.2010.04.045. Epub 2010 May 27.

Robust growth of Escherichia coli

Affiliations

Robust growth of Escherichia coli

Ping Wang et al. Curr Biol. .

Abstract

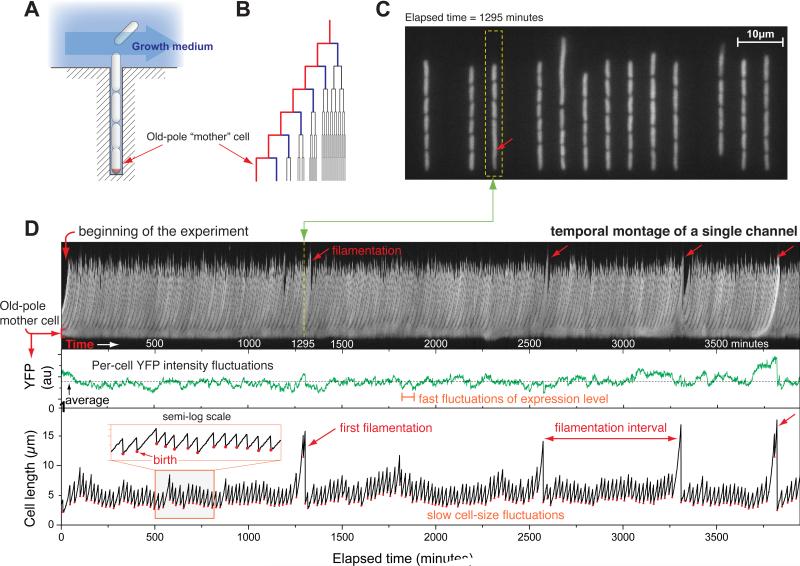
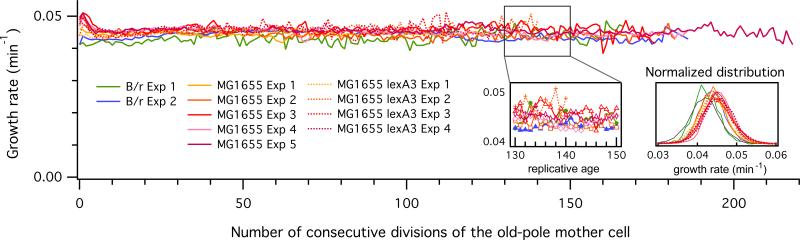
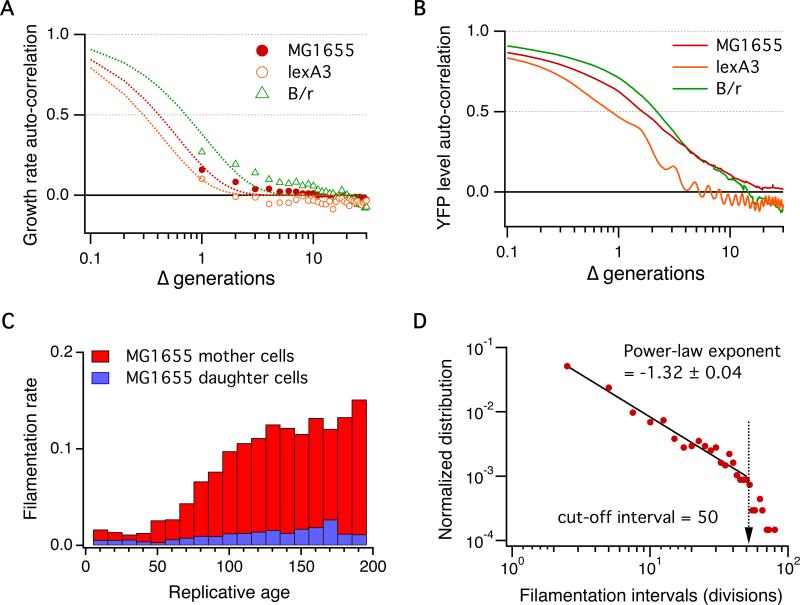
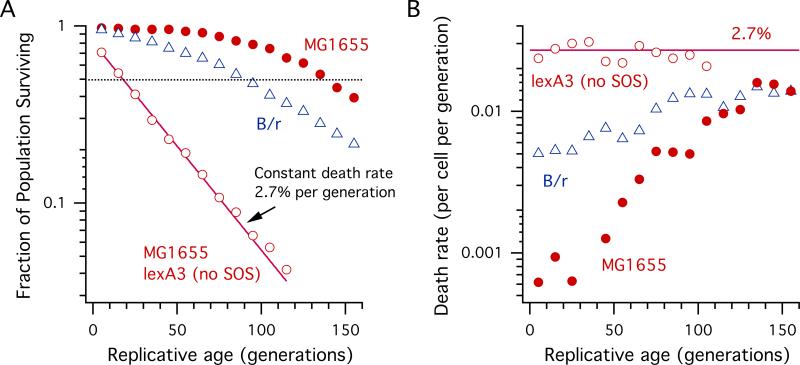
The quantitative study of the cell growth has led to many fundamental insights in our understanding of a wide range of subjects, from the cell cycle to senescence. Of particular importance is the growth rate, whose constancy represents a physiological steady state of an organism. Recent studies, however, suggest that the rate of elongation during exponential growth of bacterial cells decreases cumulatively with replicative age for both asymmetrically and symmetrically dividing organisms, implying that a "steady-state" population consists of individual cells that are never in a steady state of growth. To resolve this seeming paradoxical observation, we studied the long-term growth and division patterns of Escherichia coli cells by employing a microfluidic device designed to follow steady-state growth and division of a large number of cells at a defined reproductive age. Our analysis of approximately 10(5) individual cells reveals a remarkable stability of growth whereby the mother cell inherits the same pole for hundreds of generations. We further show that death of E. coli is not purely stochastic but is the result of accumulating damages. We conclude that E. coli, unlike all other aging model systems studied to date, has a robust mechanism of growth that is decoupled from cell death.


Figures

Fig. 1
Fig. 1
The “mother machine” and high-throughput observation of the mother cells. (A) Schematic illustration of the microfluidic mother machine. The old-pole mother cell is trapped at the end of the growth channel. (B) The outer-most branch of the lineage tree represents the old-pole mother cell and her progeny. (C) Snapshot of a typical field of view. (D) (top panel) Temporal montage of a single growth channel [within the dotted yellow box in (C)] from the beginning to the end of the experiment. The stable band on the bottom of the montage is the old-pole mother cell, whereas the “feather” of the montage show the growth and escape of her progeny; (mid panel) the average YFP intensity of the mother cell fast fluctuating around the mean without decay with time; (bottom panel) cell length vs. time of the old-pole mother cell, which shows occasional spikes (filamentations). In all three panels, the x-axis represents time in minutes.
Fig. 2
Fig. 2
Long-term stability of growth rate in E. coli. The elongation rate does not show any cumulative decrease over 200 generations in all three strains (B/r, MG1655, MG1655 lexA3). The growth rates show fast fluctuations with short-term correlation following Gaussian distribution. These eleven curves represent over ~105 individual mother cells, namely, ~107 measured cell length.
Fig. 3
Fig. 3
Short-term correlation of growth rates vs. long-term inheritance of a “factor” in the mother cell. (A) Auto-correlation function of growth rates showing less than 1 generation of correlation time. The dashed lines are a fit to the data using a single exponential function (to guide the eye): exp(-0.7x), exp(-0.43x) and exp(-x) for MG1655, MG1655 lexA3 and B/r, respectively. (B) Auto-correlation function of YFP level also showing 1-2 generations of correlation time. (C) Filamentation rate of MG1655. At a critical replicative age of the first 50 generations, the filamentation rate of the mother cell starts to increase, in contrast to the daughter cells that continue to divide normally. (D) A power-law distribution of filamentation intervals characterized by a long tail. Together with the increasing filamentation rate in (C), this implies a long-term memory that is independent of the observed stable growth and protein synthesis shown in Figs. 1 and 2.
Fig. 4
Fig. 4
Survival and mortality rate analysis showing aging of E. coli. (A) Survival curves of B/r, MG1655 and MG1655 lexA3 mutant (no SOS response). The pure exponential decay of the MG1655 lexA3 population with time allows us to directly extract 2.7% of constant death rate per generation in the absence of the SOS response. The higher survival rate of MG1655 is due to the SOS response. The dotted horizontal line represents 50% decay of the initial populations. (B) Death rate computed by numerically differentiating the survival curves in (A). Both B/r and MG1655 show increasing mortality rates, whereas MG1655 lexA3 shows a constant 2.7% rate of cell death.

Comment in

Similar articles

Cited by

References

    1. Monod J. The growth of bacterial cultures. Annu. Rev. Microbiol. 1949;3:371–394.
    1. Schaechter M, Maaloe O, Kjeldgaard NO. Dependency on Medium and Temperature of Cell Size and Chemical Composition during Balanced Growth of Salmonella typhimurium. J Gen Microbiol. 1958;19(3):592–606. - PubMed
    1. Kjeldgaard NO, Maaloe O, Schaechter M. The transition between different physiological states during balanced growth of Salmonella typhimurium. J Gen Microbiol. 1958;19(3):607–616. - PubMed
    1. Helmstetter C, Cooper S. DNA synthesis during the division cycle of rapidly growing Escherichia coli B/r. J. Mol. Biol. 1968;31:507–518. - PubMed
    1. Donachie WD. Relationship between cell size and time of initiation of DNA replication. Nature. 1968;219:1077–1079. - PubMed

Publication types

MeSH terms