. 2010 Jun;4(3):267-83.
doi: 10.1016/j.molonc.2010.04.010. Epub 2010 May 5.

Tracing the tumor lineage

Affiliations

Tracing the tumor lineage

Nicholas E Navin et al. Mol Oncol. 2010 Jun.

Erratum in

  • Mol Oncol. 2011 Jun;5(3):302

Abstract

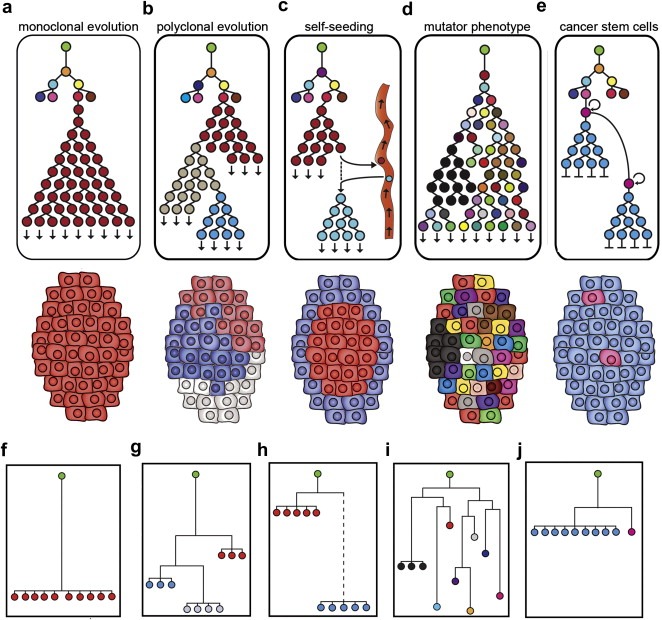
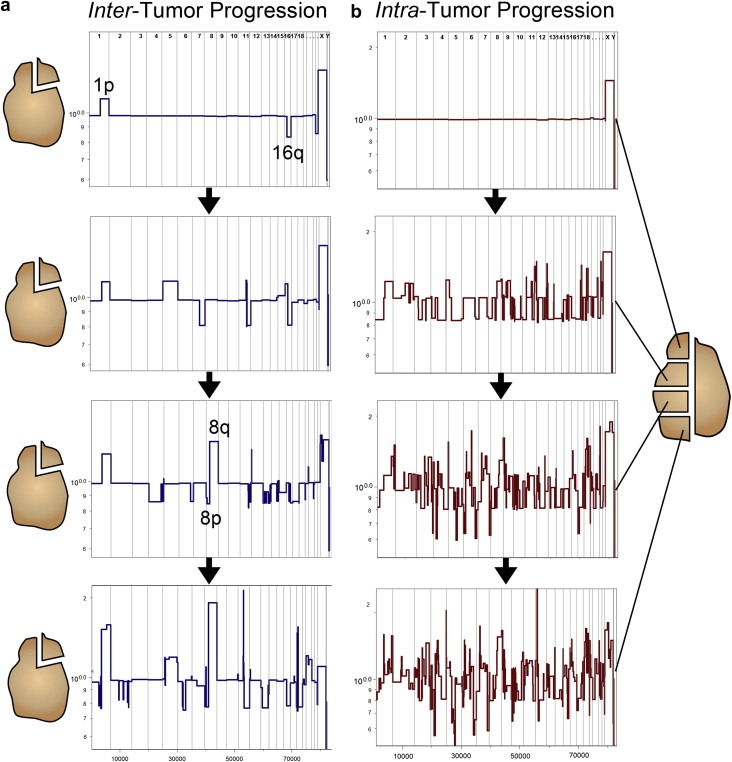
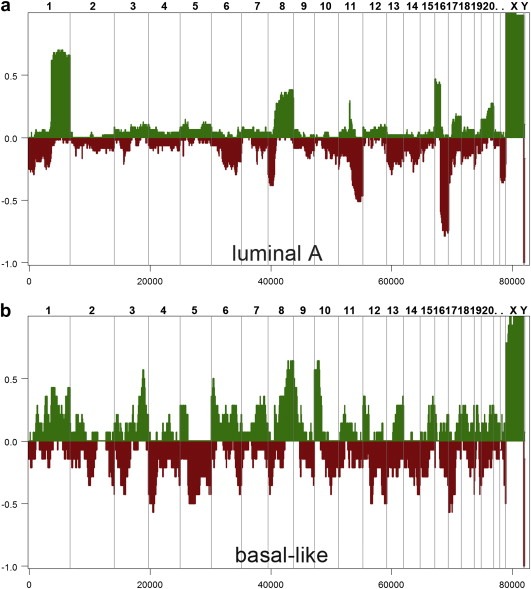
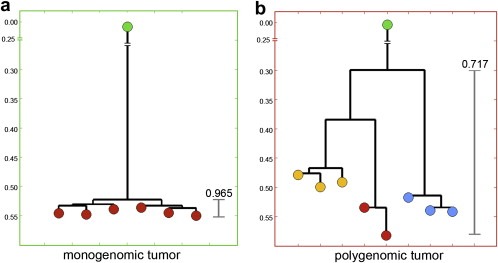
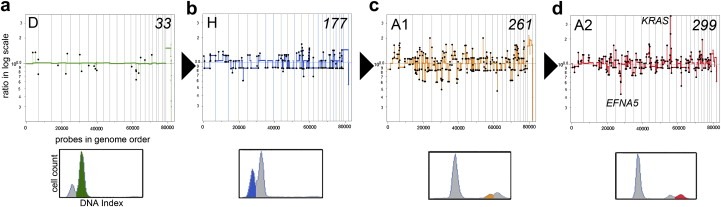
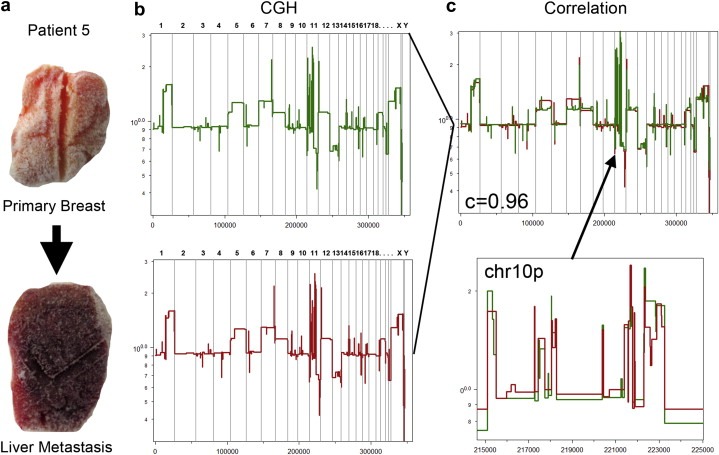
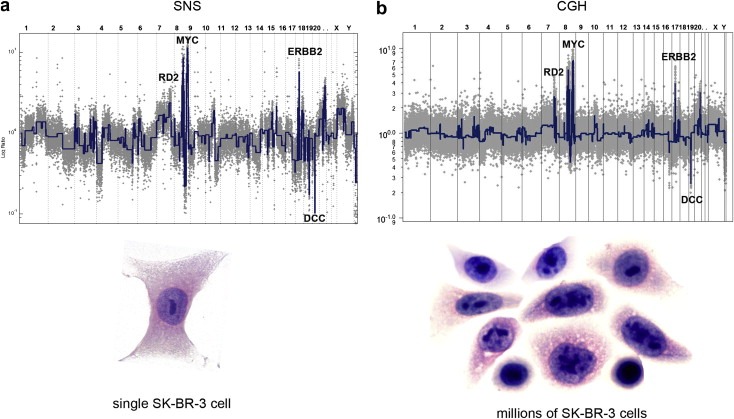
Defining the pathways through which tumors progress is critical to our understanding and treatment of cancer. We do not routinely sample patients at multiple time points during the progression of their disease, and thus our research is limited to inferring progression a posteriori from the examination of a single tumor sample. Despite this limitation, inferring progression is possible because the tumor genome contains a natural history of the mutations that occur during the formation of the tumor mass. There are two approaches to reconstructing a lineage of progression: (1) inter-tumor comparisons, and (2) intra-tumor comparisons. The inter-tumor approach consists of taking single samples from large collections of tumors and comparing the complexity of the genomes to identify early and late mutations. The intra-tumor approach involves taking multiple samples from individual heterogeneous tumors to compare divergent clones and reconstruct a phylogenetic lineage. Here we discuss how these approaches can be used to interpret the current models for tumor progression. We also compare data from primary and metastatic copy number profiles to shed light on the final steps of breast cancer progression. Finally, we discuss how recent technical advances in single cell genomics will herald a new era in understanding the fundamental basis of tumor heterogeneity and progression.


Figures

Figure 1
Figure 1
Tumor progression models and lineages. Green root nodes represent normal diploid cells, colored nodes are different tumor clones. (a–e) Models for tumor progression and phylogenetic lineages. (f–j) Hypothetical neighbor‐joining (NJ) trees constructed using 10 copy number profiles from a single tumor. (a) Monoclonal evolution forms a monogenomic tumor (b) Polyclonal evolution forms a polygenomic tumor (c) Self‐seeding results in a tumor with a divergent peripheral subpopulation (d) Mutator phenotype generates a tumor with many diverse clones (e) Cancer stem cell progression results in a tumor with a minority of pink cancer stem cells (f) NJ tree of a monogenomic tumor (g) NJ tree of a polygenomic tumor (h) NJ tree of a self‐seeded tumor with a dotted line representing a large phylogenetic distance (i) NJ of a mutator phenotype tumor (j) NJ tree of a cancer stem cell tumor.
Figure 2
Figure 2
Inter and intra‐tumor comparisons of copy number profiles. (a) Inter‐tumor comparisons. A single sample was resected from four different luminal A breast tumors and CGH profiles were measured and segmented. The profiles shown were ordered based on increasing genomic complexity. (b) Intra‐tumor comparisons. Four samples were taken from a single heterogeneous basal‐like breast carcinoma. Nuclei were isolated from each quadrant and samples were flow‐sorted by ploidy, followed by microarray CGH profiling. The profiles are ordered based on increasing numbers of chromosome breakpoints.
Figure 3
Figure 3
Frequency plots of luminal A and basal‐like breast tumors. Microarray CGH was used to generate copy number profiles from collections of luminal A and basal‐like breast tumors. The frequency plots were calculated from segmented copy number profiles. (a) Luminal A frequency plot was calculated from 45 tumor samples. (b) Basal‐like frequency plot was calculated from 23 tumor samples.
Figure 4
Figure 4
Empirical neighbor‐joining trees. Multiple copy number profiles were measured in two different breast tumors by Sector‐Ploid‐Profiling. Pearson correlations were calculated between all profiles and neighbor‐joining trees were constructed. (a) A monogenomic tumor showing a flat tree structure with a high correlation between all nodes (b) A polygenomic tree showing three groups of highly similar profiles (yellow, red, blue) that represent distinct subpopulations.
Figure 5
Figure 5
Genomic progression in a basal‐like breast tumor. Sector‐Ploidy‐Profiling was used to measure and compare twenty copy number profiles from 6 different sectors of a basal‐like tumor. (Upper Panels) Copy number profiles were segmented, clustered and coalesced to generate representative profiles from each major subpopulation: diploid (D), hypodiploid (H), aneuploid 1 (A1) and aneuploid 2 (A2). The profiles were ordered based on increasing numbers of chromosome breakpoints from 33 to 299. (Lower Panels) FACS Histograms of ploidy. (a) Diploid subpopulation with a 2N total DNA content by FACS (b) Hypodiploid subpopulation with a downward shift in ploidy (c) Aneuploid 1 subpopulation shows an upwards shift in ploidy (d) Aneuploid 2 subpopulation shows the highest total DNA content.
Figure 6
Figure 6
Genomic progression in a metastatic breast cancer patient. (a) A frozen primary breast tumor and metastatic liver tumor resected from a single patient. (b) CGH profiles measured by Representational Oligonucleotide Microarray Analysis (ROMA). The segmented breast tumor profile is plotted in green and liver profile is plotted in red. (c) (Upper Panel) Segmented breast and liver profiles are plotted and a high Pearson's correlation was calculated (c = 0.96) between the copy number events. (Lower Panel) An enlarged region of Chromosome 10p is plotted showing the high similarity between complex rearrangements in the primary and metastatic tumors.
Figure 7
Figure 7
Single cell vs. million cell copy number profiles. Single Nucleus Sequencing (SNS) was used to profile copy number in a single SK‐BR‐3 cell and microarray CGH was used to profile copy number in approximately one million SK‐BR‐3 cells. (a) Next‐generation sequencing was used to measure genome‐wide read depth in a single SK‐BR‐3 cell on one Illumina flowcell lane. Reads were counted in 50 kb intervals across the human genome to generate a copy number profile (gray) from which segments were calculated (blue). (b) CGH profile of one million SK‐BR‐3 cells. The copy number ratio data are plotted in gray and the segmented profile in blue.

Similar articles

Cited by

References

    1. Adams, J.M. , Strasser, A. , 2008. Is tumor growth sustained by rare cancer stem cells or dominant clones?. Cancer Res. 68, 4018–4021. - PubMed
    1. Al-Hajj, M. , Wicha, M.S. , Benito-Hernandez, A. , Morrison, S.J. , Clarke, M.F. , 2003. Prospective identification of tumorigenic breast cancer cells. Proc. Natl. Acad. Sci. U S A. 100, 3983–3988. - PMC - PubMed
    1. Alkan, C. , Kidd, J.M. , Marques-Bonet, T. , Aksay, G. , Antonacci, F. , Hormozdiari, F. , Kitzman, J.O. , Baker, C. , Malig, M. , Mutlu, O. , 2009. Personalized copy number and segmental duplication maps using next-generation sequencing. Nat. Genet. 41, 1061–1067. - PMC - PubMed
    1. Allred, D.C. , Wu, Y. , Mao, S. , Nagtegaal, I.D. , Lee, S. , Perou, C.M. , Mohsin, S.K. , O'Connell, P. , Tsimelzon, A. , Medina, D. , 2008. Ductal carcinoma in situ and the emergence of diversity during breast cancer evolution. Clin. Cancer Res. 14, 370–378. - PubMed
    1. Aubele, M. , Mattis, A. , Zitzelsberger, H. , Walch, A. , Kremer, M. , Hutzler, P. , Höfler, H. , Werner, M. , 1999. Intratumoral heterogeneity in breast carcinoma revealed by laser-microdissection and comparative genomic hybridization. Cancer Genet. Cytogenet. 110, 94–102. - PubMed

Publication types