

Ocular pharmacokinetic study of a corticosteroid by 19F MR
- PMID: 20537996
- PMCID: PMC2938785
- DOI: 10.1016/j.exer.2010.05.022
Ocular pharmacokinetic study of a corticosteroid by 19F MR
Abstract
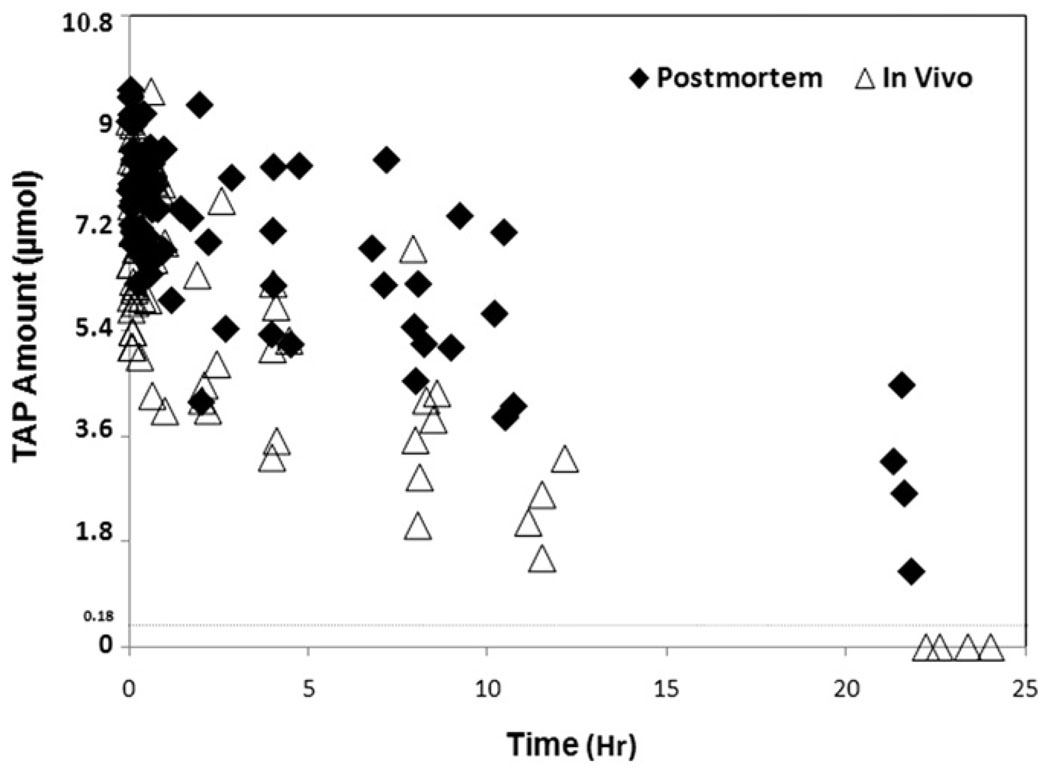
Traditional ocular pharmacokinetic studies are invasive and cannot be easily applied to humans in vivo. To acquire in vivo ocular pharmacokinetic data noninvasively, (19)F MR on a 3T clinical scanner was used to follow the real time dynamics of a corticosteroid in the eye. (1)H MR was also performed to locate the site of administration. Triamcinolone acetonide phosphate (TAP) was the model drug, administered by intravitreal and subconjunctival injections. TAP pharmacokinetics were monitored by changes in the (19)F spectrum of the intraocular drug in real time. The elimination half-lives of TAP in the eye after intravitreal and subconjunctival injections were 8 and 0.5 h in vivo and 17 and 6.0 h postmortem, respectively. The half-lives associated with clearance were 14 h for intravitreal injection and 0.5 h for subconjunctival injection.
Published by Elsevier Ltd.
Figures


Similar articles
-
A rabbit model for assessing the ocular barriers to the transscleral delivery of triamcinolone acetonide.Exp Eye Res. 2006 Mar;82(3):479-87. doi: 10.1016/j.exer.2005.08.007. Epub 2005 Sep 15. Exp Eye Res. 2006. PMID: 16168412
-
Intraocular concentration and pharmacokinetics of triamcinolone acetonide after a single intravitreal injection.Ophthalmology. 2003 Apr;110(4):681-6. doi: 10.1016/S0161-6420(02)01969-3. Ophthalmology. 2003. PMID: 12689886
-
Difference in clearance of intravitreal triamcinolone acetonide between vitrectomized and nonvitrectomized eyes.Retina. 2005 Jul-Aug;25(5):556-60. doi: 10.1097/00006982-200507000-00002. Retina. 2005. PMID: 16077349
-
Pharmacokinetics of triamcinolone acetonide for the treatment of macular edema.Expert Opin Drug Metab Toxicol. 2011 Oct;7(10):1327-35. doi: 10.1517/17425255.2011.606215. Epub 2011 Jul 27. Expert Opin Drug Metab Toxicol. 2011. PMID: 21790508 Review.
-
[Intravitreal triamcinolone acetonide for the treatment of intraocular edematous and neovascular diseases].Ophthalmologe. 2004 Feb;101(2):113-20. doi: 10.1007/s00347-003-0982-0. Ophthalmologe. 2004. PMID: 14991306 Review. German.
Cited by
-
MRI study of subconjunctival and intravitreal injections.J Pharm Sci. 2012 Jul;101(7):2353-63. doi: 10.1002/jps.23127. Epub 2012 Mar 30. J Pharm Sci. 2012. PMID: 22473517 Free PMC article.
-
Study of kinetics of 19F-MRI using a fluorinated imaging agent (19FIT) on a 3T clinical MRI system.MAGMA. 2019 Feb;32(1):97-103. doi: 10.1007/s10334-018-0707-7. Epub 2018 Oct 5. MAGMA. 2019. PMID: 30291487
References
-
- Barza M, Kane A, Baum J. The effects of infection and probenecid on the transport of carbenicillin from the rabbit vitreous humor. Invest. Ophthalmol. Vis. Sci. 1982;22:720–726. - PubMed
-
- Barza M, Lynch E, Baum JL. Pharmacokinetics of newer cephalosporins after subconjunctival and intravitreal injection in rabbits. Arch. Ophthalmol. 1993;111:121–125. - PubMed
-
- Berkowitz BA, Roberts R, Luan H, Peysakhov J, Mao X, Thomas KA. Dynamic contrast-enhanced MRI measurements of passive permeability through blood retinal barrier in diabetic rats. Invest. Ophthalmol. Vis. Sci. 2004;45:2391–2398. - PubMed
-
- Berthe P, Baudouin C, Garraffo R, Hofmann P, Taburet AM, Lapalus P. Toxicologic and pharmacokinetic analysis of intravitreal injections of foscarnet, either alone or in combination with ganciclovir. Invest. Ophthalmol. Vis. Sci. 1994;35:1038–1045. - PubMed
-
- Cheng L, Banker AS, Martin M, Kozak I, Freeman WR. Triamcinolone acetonide concentration of aqueous humor after decanted 20-mg intravitreal injection. Ophthalmology. 2009;116:1356–1359. - PubMed
Publication types
MeSH terms
Substances
Grants and funding
LinkOut - more resources
Full Text Sources
Medical
Miscellaneous
