. 2010 Sep 1;169(3):1449-61.
doi: 10.1016/j.neuroscience.2010.05.075. Epub 2010 Jun 9.

Dynamic imaging reveals that brain-derived neurotrophic factor can independently regulate motility and direction of neuroblasts within the rostral migratory stream

Affiliations

Dynamic imaging reveals that brain-derived neurotrophic factor can independently regulate motility and direction of neuroblasts within the rostral migratory stream

J A Bagley et al. Neuroscience. .

Abstract

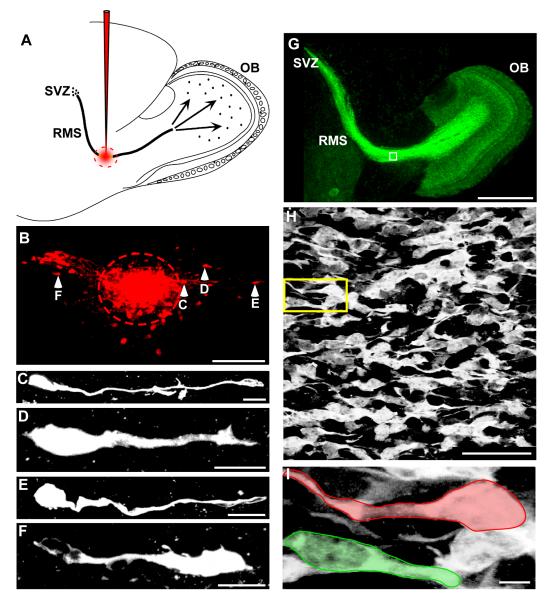
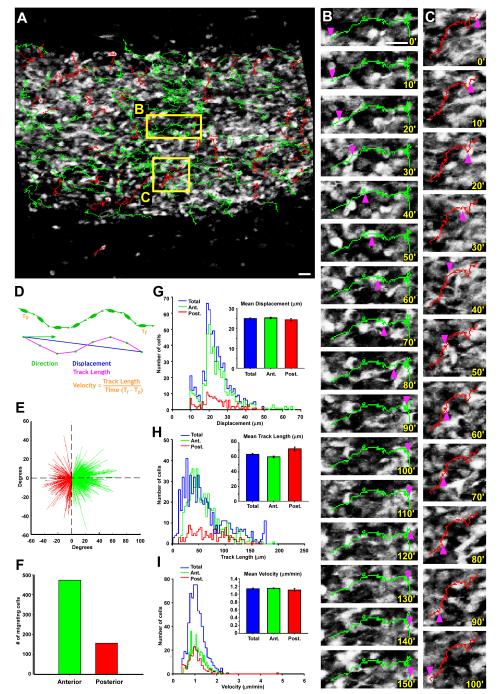
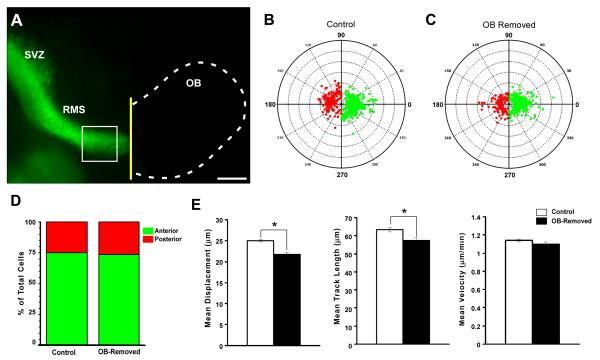
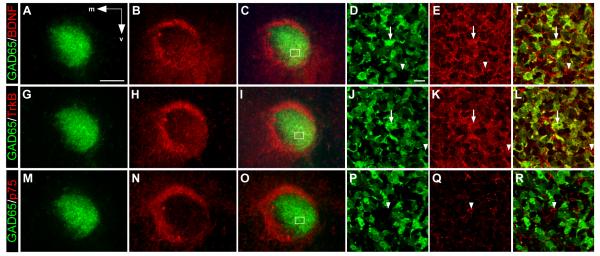
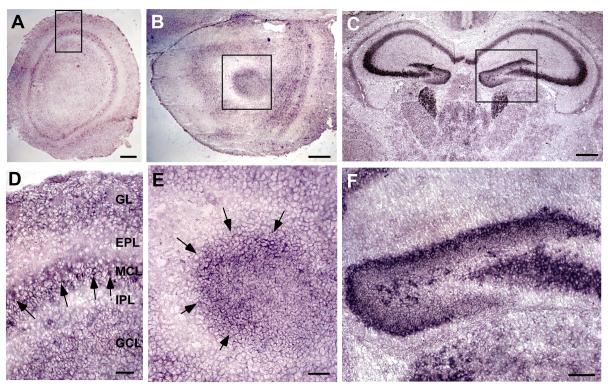
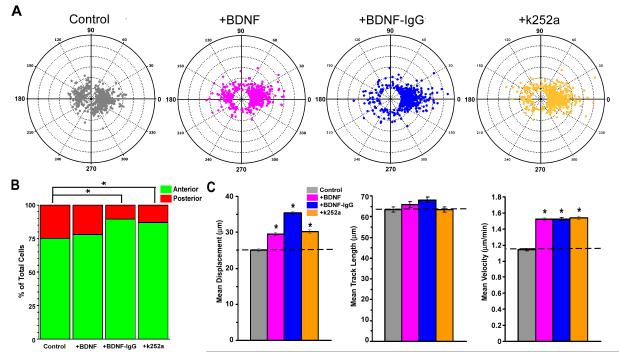
Neuronal precursors generated in the subventricular zone (SVZ) migrate through the rostral migratory stream (RMS) to the olfactory bulb (OB). Although, the mechanisms regulating this migration remain largely unknown. Studies have shown that molecular factors, such as brain-derived neurotrophic factor (BDNF) emanating from the OB, may function as chemoattractants drawing neuroblasts toward their target. To better understand the role of BDNF in RMS migration, we used an acute slice preparation from early postnatal mice to track the tangential migration of GAD65-GFP labeled RMS neuroblasts with confocal time-lapse imaging. By quantifying the cell dynamics using specific directional and motility criteria, our results showed that removal of the OB did not alter the overall directional trajectory of neuroblasts, but did reduce their motility. This suggested that additional guidance factors present locally within the RMS region also contribute to this migration. Here we report that BDNF and its high affinity receptor, tyrosine kinase receptor type 2 (TrkB), are indeed heterogeneously expressed within the RMS at postnatal day 7. By altering BDNF levels within the entire pathway, we showed that reduced BDNF signaling changes both neuroblast motility and direction, while increased BDNF levels changes only motility. Together these data reveal that during this early postnatal period BDNF plays a complex role in regulating both the motility and direction of RMS flow, and that BDNF comes from sources within the RMS itself, as well as from the olfactory bulb.


Figures

Figure 1
Figure 1. RMS neuroblasts migrate bidirectionally in vivo and in GAD65-GFP mice
(A) Sagittal schematic view of an in vivo dextran-rhodamine injection site, shown in red, targeted to the RMS. (B) Fluorescent image of a histological section 4 hours after RMS injection, showing cells (arrowheads) having moved both anterior and posterior to the injection site (dashed circle). (C-F) High magnification view of cells in B, showing a leading process in both anteriorly migrating cells (C-E), and a posteriorly migrating cell (F). (G) Sagittal fluorescent image showing GAD65-GFP expression throughout the entire SVZ-OB migratory pathway. (H) High magnification of boxed region in G showing RMS neuroblasts. (I) Higher magnification of yellow boxed region in H showing a pair of migrating cells outlined by colored boundaries tracing both the anterior (green) and posterior (red) leading processes. Scale bars: B, 150μm; C-F, 10μm; G, 1mm; H, 40μm; I, 5μm.
Figure 2
Figure 2. Dynamic imaging shows broad bidirectional migration in the RMS neuroblast population
(A) Image of the RMS from an acute slice with overlaid tracks showing cells moving in an anterior (green) or posterior (red) direction. (B-C) Close-up views of the boxed regions in A, showing the time-lapse sequence and tracks of single cells moving in an anterior direction (B) and a posterior direction (C). Pink arrowheads point to the location of the cell bodies in each panel, with the time (minutes) indicated in the lower right corner. (D) Schematic representation of the method used to quantify the mobility characteristics of each cell. (E-I) Time lapse analysis of 629 migrating GAD65-GFP neuroblasts (n=4 experiments). (E) Vector plot showing the displacement and direction of each neuroblast plotted from a common origin (initial position). Green vectors represent neuroblasts with a net anterior displacement. Red vectors represent neuroblasts with a net posterior displacement. (F) Bar graph of migrating cells shown in E, presenting a total of 473 RMS neuroblasts moving anteriorly (75.20% of total cells) and 156 moving posteriorly (24.80% of total cells). (G-I) Distribution plots of motility measures for displacement (G), track length (H) and velocity (I) of migrating neuroblasts showing anterior (green), posterior (red), and combined total migrating neuroblasts (blue). Comparisons between anterior and posterior sub-populations reveal no significant differences in average motility characteristics using Student t-test (inset bar graphs). Scale bar: 10μm.
Figure 3
Figure 3. Removal of the olfactory bulb alters cell motility but not direction of migration
(A) Fluorescent sagittal image of an acute brain slice from a GAD65-GFP mouse in which the OB (dotted line) has been removed (yellow line) before time-lapse imaging. (B, C) Polar plots illustrating the final position of each tracked cell with respect to its initial starting position plotted from a common origin (center). Cells migrating in an anterior direction are plotted in green and those migrating in a posterior direction are plotted in red. The control condition is shown in (B) (n=4 experiments; 629 cells tracked), and following OB removal (n=4 experiments; 486 cells tracked) is shown in (C). (D) Graph summarizing the population data from B and C, revealing no significant difference between the two groups (control, 75.20% of cells migrated anteriorly; 24,80% migrated posteriorly, n=629 from 4 experiments; OB removed, 73.25% of cells migrated anteriorly, 26.75% of cells moved posteriorly; p=0.568 using the Mann-Whitney-Wilcoxon rank sum test.). (E) Graphs showing mean motility measures of cells in control (white bars) and OB-removed (black bars) groups, revealing a significant reduction in displacement (Left graph: control, 25.04 ± 0.36 μm, S.E.; OB-removed, 21.81 ± 0.42 μm, S.E.; n=486 cells from 4 experiments; p<0.0001), and Track Length (Middle graph: control, 63.35 ± 1.22 μm, S.E., n=629 cells from 4 experiments; OB-removed, 57.31± 0.42 μm, S.E; n=486 cells from 4 experiments; p<0.01) but not Velocity (Right graph: control; 1.14 ± 0.015 μm/min, S.E. n=629 cells from 4 experiments; OB-removed, 1.1 ± 0.023 μm/min, S.E. n=486 cells from 4 experiments; p=0.141) when the OB is removed. Significance for motility measures determined using ANOVA followed by Bonferroni/Dunn post-hoc test. Scale bar: 500 μm
Figure 4
Figure 4. Differential expression of BDNF, TrkB and p75NTR within the RMS region
Coronal sections through the RMS of a P7 mouse showing GAD65-GFP (green) and antibody staining (red) against BDNF (A-F), TrkB (G-L), and p75NTR (M-R). Low power images show expression within the RMS is non-uniform for all three proteins with more elevated staining for BDNF (A-C), and TrkB (G-I), compared to p75NTR (M-O). High power images of boxed region in C and I indicating the presence of GFP+ neuroblasts that co-localize (arrows) with BDNF (D-F), and TrkB (J-L), as well as those that do not co-localize (arrowheads). (P-R) High power image of boxed region in O, showing that p75NTR is poorly expressed by RMS cells (arrowhead) and does not co-localize with GFP. Arrows in A indicate medial (m) and ventral (v) orientation. Scale bars: (in A) A-C, G-I, M-O, 100μm; (in D) D-F, J-L, P-R, 10μm.
Figure 5
Figure 5. BDNF mRNA expression in the Olfactory Bulb and RMS
In situ hybridization experiments of P7 mouse brain showing BDNF expression in the olfactory bulb (A), anterior olfactory nucleus (AON) region (B), and hippocampal area (C). (D) Close-up of boxed area in A, shows BDNF mRNA expression is highest in the mitral cell layer of the OB (Arrows). (E) Close-up of boxed area in B, showing BDNF mRNA expressed in a semicircular pattern in the RMS region. (F) Close-up of boxed area in C, showing high levels of BDNF produced in the dentate gyrus region of the hippocampus. Scale bars: A, B, 200μm; C, 400μm; D, E, 50μm; F, 100μm.
Figure 6
Figure 6. Changes in BDNF signaling alter RMS migration
(A) Polar plots showing the final position of each tracked cell with respect to its initial starting point plotted from a common origin (center) comparing control (gray), with the addition of BDNF (pink), BDNF-IgG (blue), , and k252a (orange) illustrating the directional distribution of the migrating cell populations. (B) Bar graph showing the percent of total cells from four experiments in each group migrating in an anterior (green) and posterior (red) direction under three experimental conditions revealing a significant difference in the direction of migrating cells following +BDNF-IgG (89.71% of total cells migrate anterior, 10.29% migrate posterior; n=651 cells from 4 experiments; p<0.0001), and +k252a (86.85% of total cells migrate anterior, 13.15% migrate posterior; n=707 cells from 4 experiments; p<0.0001); but not +BDNF (77.86% of total cells migrate anterior; 22.14% migrate posterior; n=569 cells from 4 experiments; p=0.413), when compared to control (75.20% of total cells migrate anterior; 24.80% migrate posterior; n=629 cells from 4 experiments) using the Mann-Whitney-Wilcoxon rank sum test. (C) Bar graphs showing motility measures for each experimental condition compared to control (dotted line in each graph). Left graph, shows significant increases in mean displacement for +BDNF (29.55 ± 0.49 μm, n=569 cells from 4 experiments), +BDNF-IgG (35.35 ± 0.5 μm, n=651 cells from 4 experiments) and +k252a (30.25 ± 0.47 μm, n=707 cells from 4 experiments) compared to control (25.04 ± 0.36 μm, n=629 cells from 4 experiments). Middle graph, shows no significant change in mean track length between experimental groups and control (+BDNF, 65.86 ± 1.55 μm, n=569 cells from 4 experiments, p=0.189; +BDNF-IgG, 68.02 ± 1.23 μm, n=651 cells from 4 experiments, p=0.011; +k252a, 63.3 ± 1.25 μm, n=707 cells from 4 experiments, p=0.977; control, 63.35 ± 1.22 μm, n=629 cells from 4 experiments) Right graph, shows significant increases in velocity for each experimental group compared to control (+BDNF, 1.52 ± 0.02 μm/min, n=569 cells from 4 experiments; +BDNF-IgG, 1.52 ± 0.02 μm/min, n=651 cells from 4 experiments; +k252a, 1.54 ± 0.02 μm/min, n=707 cells from 4 experiments; control, 1.14 ± 0.015 μm/min, n=629 cells from 4 experiments). All error ± S.E. Significance for motility measures determined using ANOVA followed by Bonferroni/Dunn post-hoc test, *p<0.0001.

Similar articles

Cited by

References

    1. Altman J. Autoradiographic and histological studies of postnatal neurogenesis. IV. Cell proliferation and migration in the anterior forebrain, with special reference to persisting neurogenesis in the olfactory bulb. J Comp Neurol. 1969;137:433–457. - PubMed
    1. Anton ES, Ghashghaei HT, Weber JL, McCann C, Fischer TM, Cheung ID, Gassmann M, Messing A, Klein R, Schwab MH, Lloyd KC, Lai C. Receptor tyrosine kinase ErbB4 modulates neuroblast migration and placement in the adult forebrain. Nat Neurosci. 2004;7:1319–1328. - PubMed
    1. Bath KG, Mandairon N, Jing D, Rajagopal R, Kapoor R, Chen ZY, Khan T, Proenca CC, Kraemer R, Cleland TA, Hempstead BL, Chao MV, Lee FS. Variant brain-derived neurotrophic factor (Val66Met) alters adult olfactory bulb neurogenesis and spontaneous olfactory discrimination. J Neurosci. 2008;28:2383–2393. - PMC - PubMed
    1. Bolteus AJ, Bordey A. GABA release and uptake regulate neuronal precursor migration in the postnatal subventricular zone. J Neurosci. 2004;24:7623–7631. - PMC - PubMed
    1. Bovetti S, Bovolin P, Perroteau I, Puche AC. Subventricular zone-derived neuroblast migration to the olfactory bulb is modulated by matrix remodelling. Eur J Neurosci. 2007;25:2021–2033. - PubMed

Publication types

Substances