

Review
doi: 10.1016/j.bbalip.2010.06.002.
Epub 2010 Jun 9.
Getting the mOST from OST: Role of organic solute transporter, OSTalpha-OSTbeta, in bile acid and steroid metabolism
Affiliations
- PMID: 20538072
- PMCID: PMC2911127
- DOI: 10.1016/j.bbalip.2010.06.002
Item in Clipboard
Review
Getting the mOST from OST: Role of organic solute transporter, OSTalpha-OSTbeta, in bile acid and steroid metabolism
Biochim Biophys Acta.
2010 Sep.
Abstract
The organic solute transporter (OST)(alpha)-OST(beta) is an unusual heteromeric carrier expressed in a variety of tissues including the small intestine, colon, liver, biliary tract, kidney, and adrenal gland. In polarized epithelial cells, OSTalpha-OSTbeta protein is localized on the basolateral membrane and functions in the export or uptake of bile acids and steroids. This article reviews recent results including studies of knockout mouse models that provide new insights to the role of OSTalpha-OSTbeta in the compartmentalization and metabolism of these important lipids.
2010 Elsevier B.V. All rights reserved.
Figures
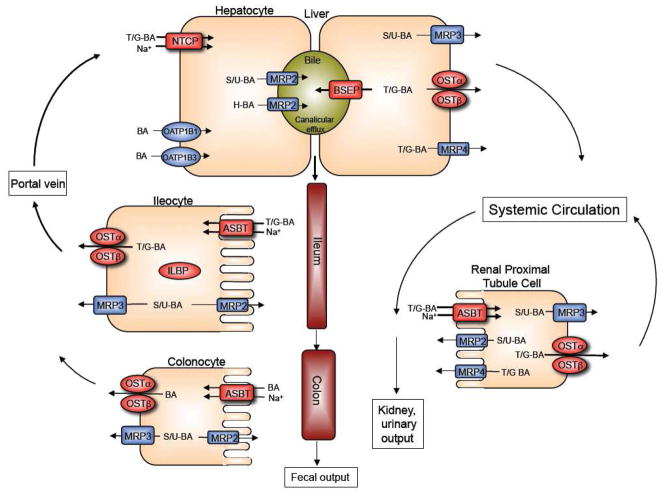
Enterohepatic circulation of bile acids showing the individual transport proteins in hepatocytes, ileocytes (ileal enterocytes), and renal proximal tubule cells. Overall, this integrated transport system minimizes fecal and urinary bile acid loss and functions to largely restrict these potentially cytotoxic detergents to the intestinal and hepatobiliary compartments. (BA, bile acids; T/G; taurine or glycine-conjugated bile acids; sulfate or glucuronide (S/U)-conjugated bile acids; H, tetrahydroxylated bile acids).
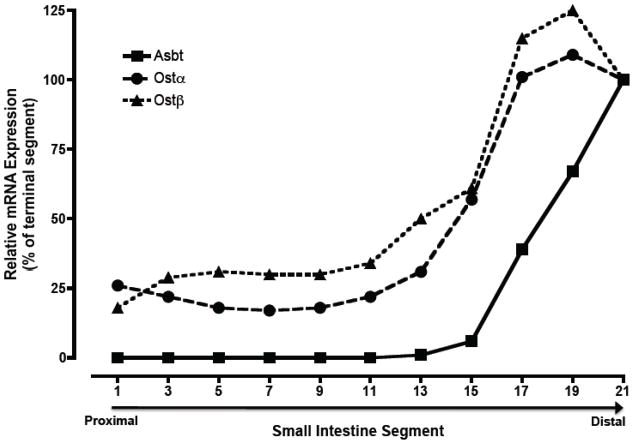
Expression of Ostα and Ostβ mRNA along the cephalocaudal axis of the small intestine from African Green monkey. Small intestine from an adult male African Green monkey was divided into 21 equal segments of ~10 cm in length and used for RNA isolation. Real-time PCR was used to determine the expression of Asbt, Ostα, and Ostβ mRNA expression. The threshold values (CT) are the means of triplicate determinations, and expression was normalized for mRNA expression of the housekeeping gene, glyceraldehyde 3-phosphate dehydrogenase. The normalized threshold values are plotted as a percent of the terminal intestinal segment (terminal ileum). The CT values determine in terminal ileum were 19.84, 22.81, and 22.90 for the Asbt, Ostα, and Ostβ, respectively.
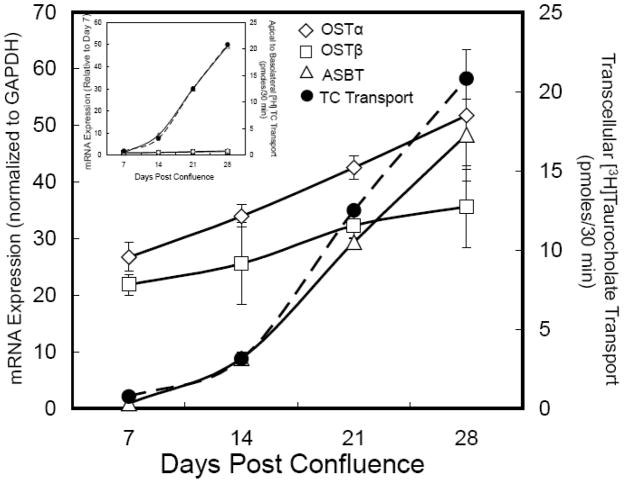
Ontogeny of OSTα-OSTβ mRNA expression and TC transport in Caco-2 cells. Caco-2 cells were seeded at high density onto transwell filters and maintained in DMEM plus 10% fetal calf serum. Two days prior to assaying bile acid transport at 7, 14, 21, and 28 days post-confluence, the cells were switched to DMEM plus 0.5% charcoal-stripped fetal calf serum to remove endogenous bile acids. At the indicated times, the cells were washed and incubated at 37°C for 30 min with 10 μM [3H]taurocholate in a Hanks balanced salt solution with sodium (137 mM) or without sodium (137 mM potassium) added to the apical chamber [32]. The transport is plotted as the pmoles of taurocholate transported corrected for the background transcellular transport measured in the Hanks balanced salt solution lacking sodium. The cells were harvested for RNA isolation to determine the mRNA expression for ASBT, OSTα and OSTβ by real time PCR. The CT values are the means of triplicate determinations and expression was normalized for GAPDH expression, which did not change between days 7 and 28 post-confluence. The results are plotted relative to the expression at day 7. The media from the basolateral chamber was collected to determine the transcellular transport of taurocholate. TC transport correlated with the appearance of ASBT mRNA at day 14 and increased ~30-fold between days 7 and 28. ASBT mRNA expression increased ~45-fold between days 7 and 28 post-confluence. OSTα and OSTβ mRNA are present at day 7 and increase ~2-fold between days 7 and 28 post-confluence. The CT values on day 28 were 22.15, 22.44, and 21.91 for ASBT, OSTα, and OSTβ mRNA, respectively. Inset, the mRNA expression is shown relative to the day 7 measurements.
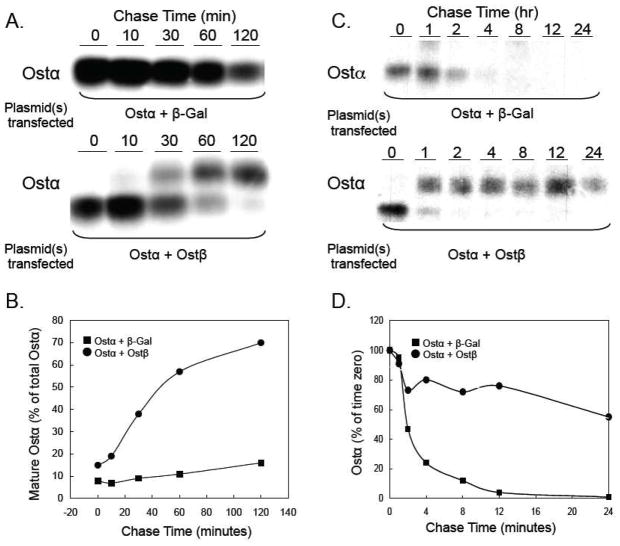
Ostβ is required for the maturation and stability of Ostα. (A) HEK 293 cells were transfected with plasmids expressing mouse Ostα and β-galactosidase or mouse Ostα and mouse Ostβ. After 24 h, the cells were pulse labeled with [35S]-methionine/cysteine for 30 min at 37°C. Following the labeling period, cells were washed and incubated at 37° C in fresh media containing unlabeled methionine and cysteine. At the indicated times, cell lysates were prepared, subjected to immunoprecipitation using an anti-Ostα antibody, and analyzed by SDS-PAGE as described [110]. (B) The Ostα bands were quantified using a using a Molecular Dynamics 445 SI Phosphorimager. The amount of mature Ostα protein (upper band) is shown as the percent of total cellular Ostα protein for each time point. In the presence of Ostβ, approximately 70% of the newly synthesized Ostα is in the mature form after 2 h. (C) HEK 293 cells were transfected with plasmids expressing mouse Ostα and β-galactosidase or mouse Ostα and mouse Ostβ. After 24 h, the cells were pulse labeled with [35S]-methionine/cysteine for 30 min at 37°C. Following the labeling period, cells were washed and incubated at 37° C in fresh media containing unlabeled methionine and cysteine. At the indicated times, cell lysates were prepared, subjected to immunoprecipitation using an anti-Ostα antibody, and analyzed by SDS-PAGE as described [110]. (D) The Ostα bands were quantified using a using a Molecular Dynamics 445 SI Phosphorimager. The results indicate that the half-life of Ostα is ~2 hours versus greater than 24 h in the absence and presence of cotransfected Ostβ, respectively.
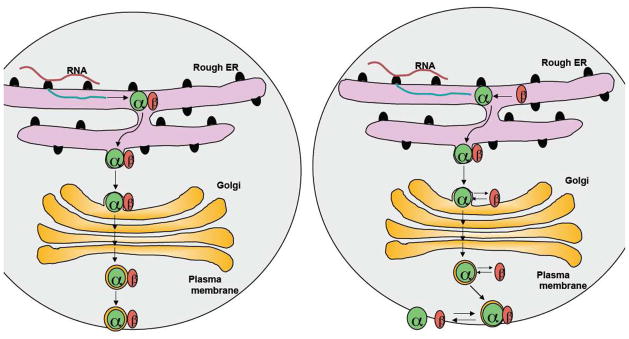
Models for the interaction of OSTα and OSTβ. (A) Model 1: OSTα and OSTβ form stable complexes and remain stably associated as they traffic through the ER and Golgi to the plasma membrane. (B) Model 2: The association of OSTβ ensures proper folding of OSTα and its appropriate targeting to the plasma membrane. After reaching the plasma membrane, the heterodimeric complex is in equilibrium with individual subunits.
Similar articles
-
Pleiotropic functions of the organic solute transporter Ostα-Ostβ.Dig Dis. 2011;29(1):13-7. doi: 10.1159/000324123. Epub 2011 Jun 17. Dig Dis. 2011. PMID: 21691099 Free PMC article. Review.
-
OSTalpha-OSTbeta: a major basolateral bile acid and steroid transporter in human intestinal, renal, and biliary epithelia.Hepatology. 2005 Dec;42(6):1270-9. doi: 10.1002/hep.20961. Hepatology. 2005. PMID: 16317684
-
The heteromeric organic solute transporter alpha-beta, Ostalpha-Ostbeta, is an ileal basolateral bile acid transporter.J Biol Chem. 2005 Feb 25;280(8):6960-8. doi: 10.1074/jbc.M412752200. Epub 2004 Nov 24. J Biol Chem. 2005. PMID: 15563450 Free PMC article.
-
Ostalpha-Ostbeta is required for bile acid and conjugated steroid disposition in the intestine, kidney, and liver.Am J Physiol Gastrointest Liver Physiol. 2008 Jul;295(1):G179-G186. doi: 10.1152/ajpgi.90319.2008. Epub 2008 May 22. Am J Physiol Gastrointest Liver Physiol. 2008. PMID: 18497332 Free PMC article.
-
Organic solute transporter, OSTalpha-OSTbeta: its role in bile acid transport and cholestasis.Semin Liver Dis. 2010 May;30(2):178-85. doi: 10.1055/s-0030-1253226. Epub 2010 Apr 26. Semin Liver Dis. 2010. PMID: 20422499 Free PMC article. Review.
Cited by
-
Heteromeric Solute Carriers: Function, Structure, Pathology and Pharmacology.Adv Exp Med Biol. 2021;21:13-127. doi: 10.1007/5584_2020_584. Adv Exp Med Biol. 2021. PMID: 33052588 Review.
-
Pleiotropic functions of the organic solute transporter Ostα-Ostβ.Dig Dis. 2011;29(1):13-7. doi: 10.1159/000324123. Epub 2011 Jun 17. Dig Dis. 2011. PMID: 21691099 Free PMC article. Review.
-
Pectin Penta-Oligogalacturonide Suppresses Intestinal Bile Acids Absorption and Downregulates the FXR-FGF15 Axis in High-Cholesterol Fed Mice.Lipids. 2017 Jun;52(6):489-498. doi: 10.1007/s11745-017-4258-x. Epub 2017 May 4. Lipids. 2017. PMID: 28474246
-
Host metabolism dysregulation and cell tropism identification in human airway and alveolar organoids upon SARS-CoV-2 infection.Protein Cell. 2021 Sep;12(9):717-733. doi: 10.1007/s13238-020-00811-w. Epub 2020 Dec 12. Protein Cell. 2021. PMID: 33314005 Free PMC article.
-
Pleiotropic roles of bile acids in metabolism.Cell Metab. 2013 May 7;17(5):657-69. doi: 10.1016/j.cmet.2013.03.013. Epub 2013 Apr 18. Cell Metab. 2013. PMID: 23602448 Free PMC article. Review.
References
-
- Lin MC, Weinberg SL, Kramer W, Burckhardt G, Wilson FA. Identification and comparison of bile acid-binding polypeptides in ileal basolateral membrane. J Membr Biol. 1988;106:1–11. - PubMed
-
- Hirohashi T, Suzuki H, Takikawa H, Sugiyama Y. ATP-dependent transport of bile salts by rat multidrug resistance-associated protein 3 (Mrp3) J Biol Chem. 2000;275:2905–2910. - PubMed
Publication types
MeSH terms
Substances
Grants and funding
LinkOut - more resources
Full Text Sources
Other Literature Sources
