

Involvement of mast cells in eosinophilic esophagitis
- PMID: 20538331
- PMCID: PMC2902643
- DOI: 10.1016/j.jaci.2010.04.009
Involvement of mast cells in eosinophilic esophagitis
Abstract
Background: Eosinophilic esophagitis (EE) is an emerging disorder with poorly understood pathogenesis.
Objective: Whereas prior studies have primarily focused on the role of eosinophils in disease diagnosis and pathogenesis, this study investigates the involvement of mast cells.
Methods: Total and degranulated mast cell counts were correlated to microarray and RT-PCR data to generate transcriptome expression profiles related to mast cell number and degranulation in patients with EE and healthy control subjects.
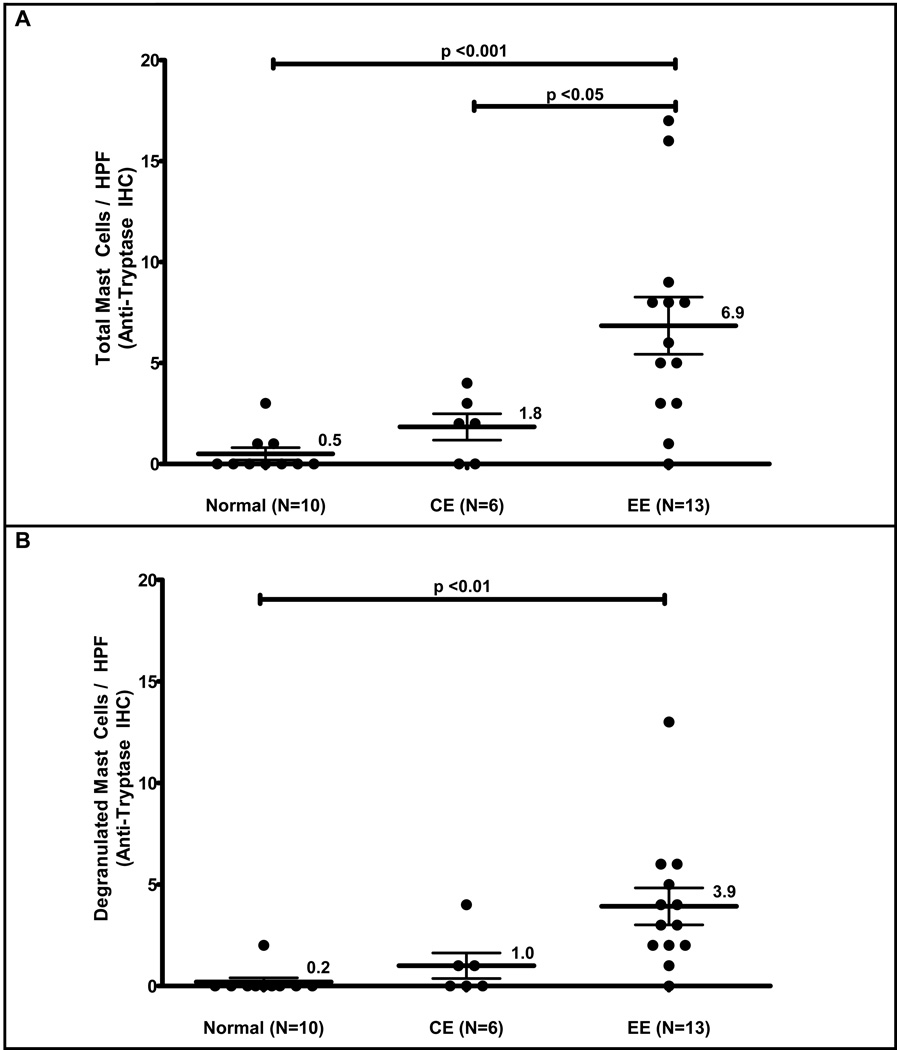
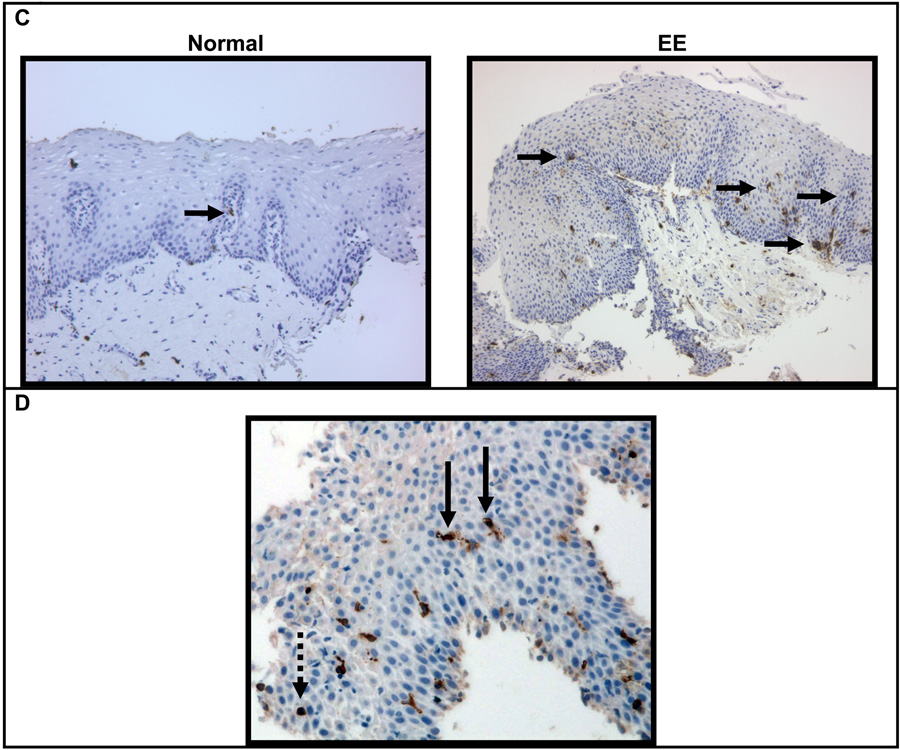
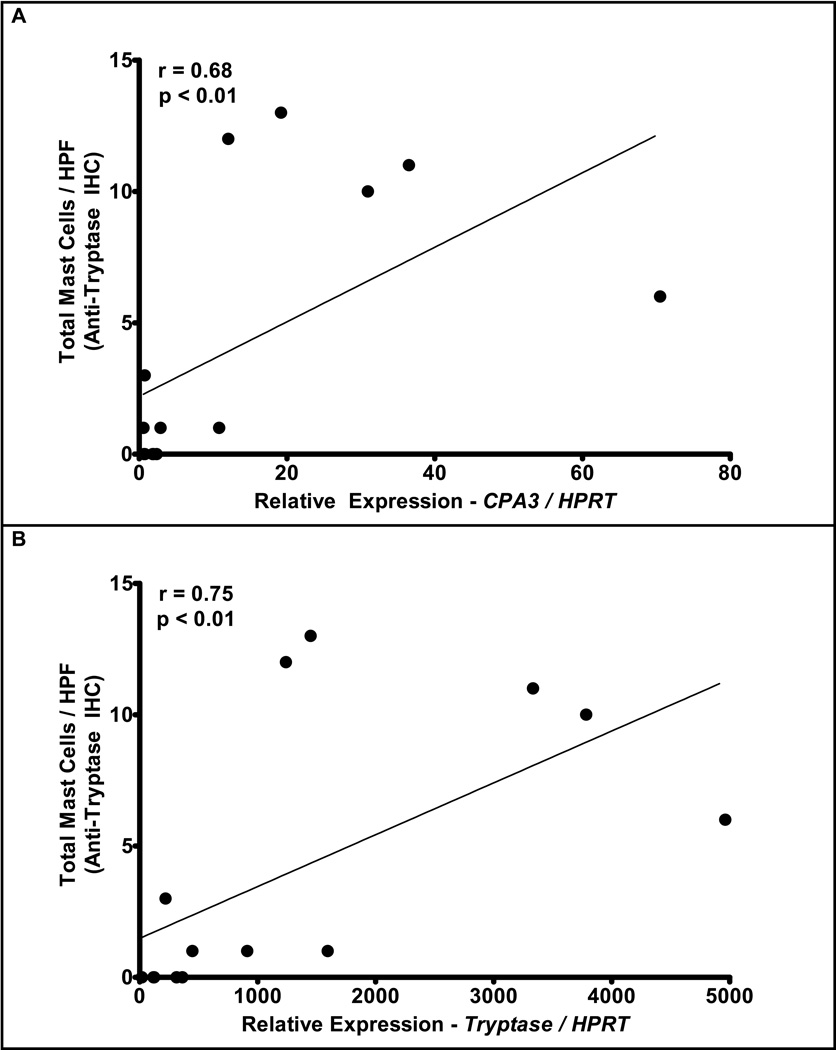
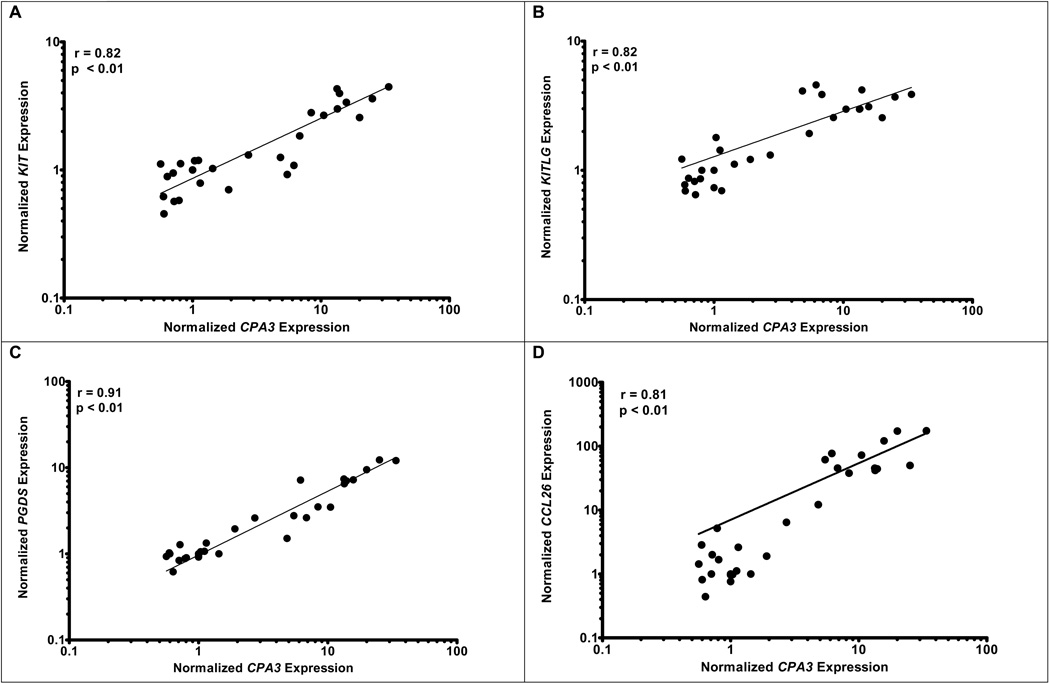
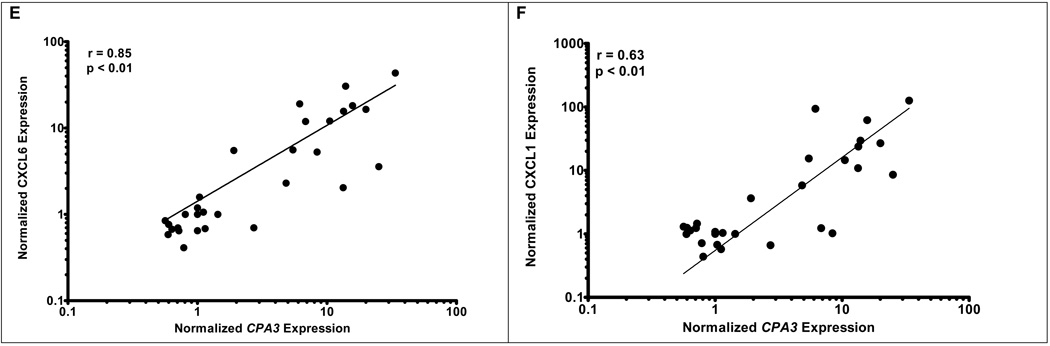
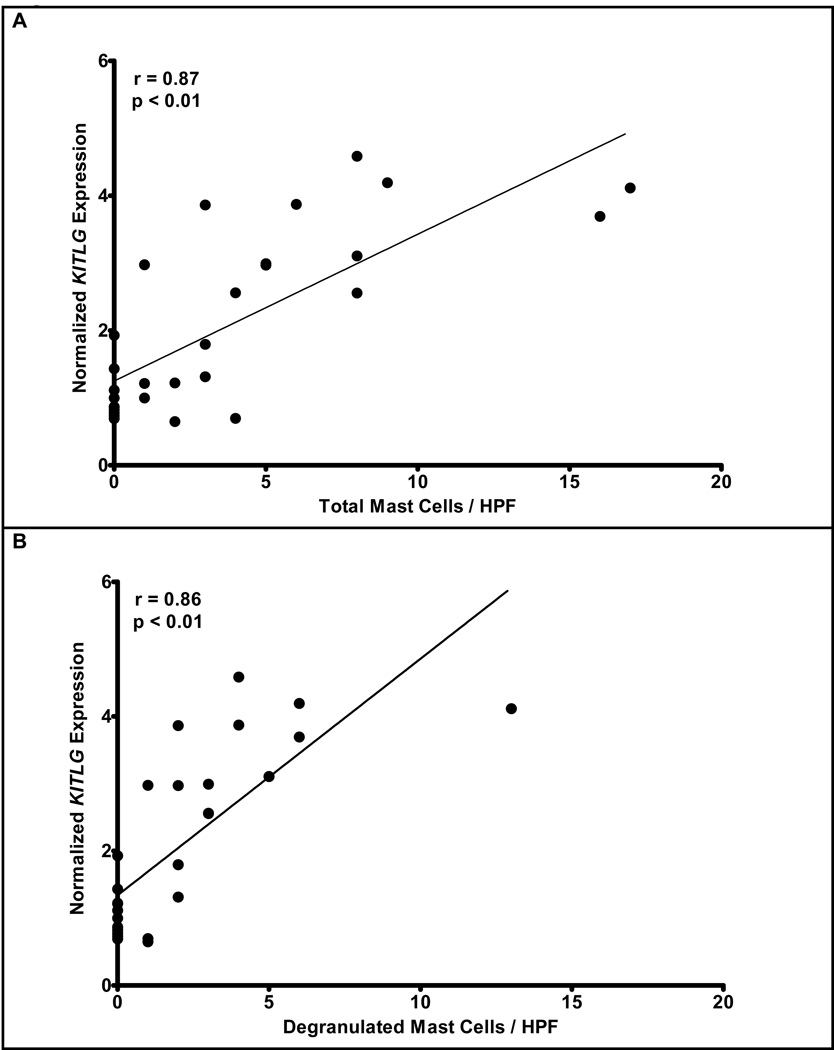
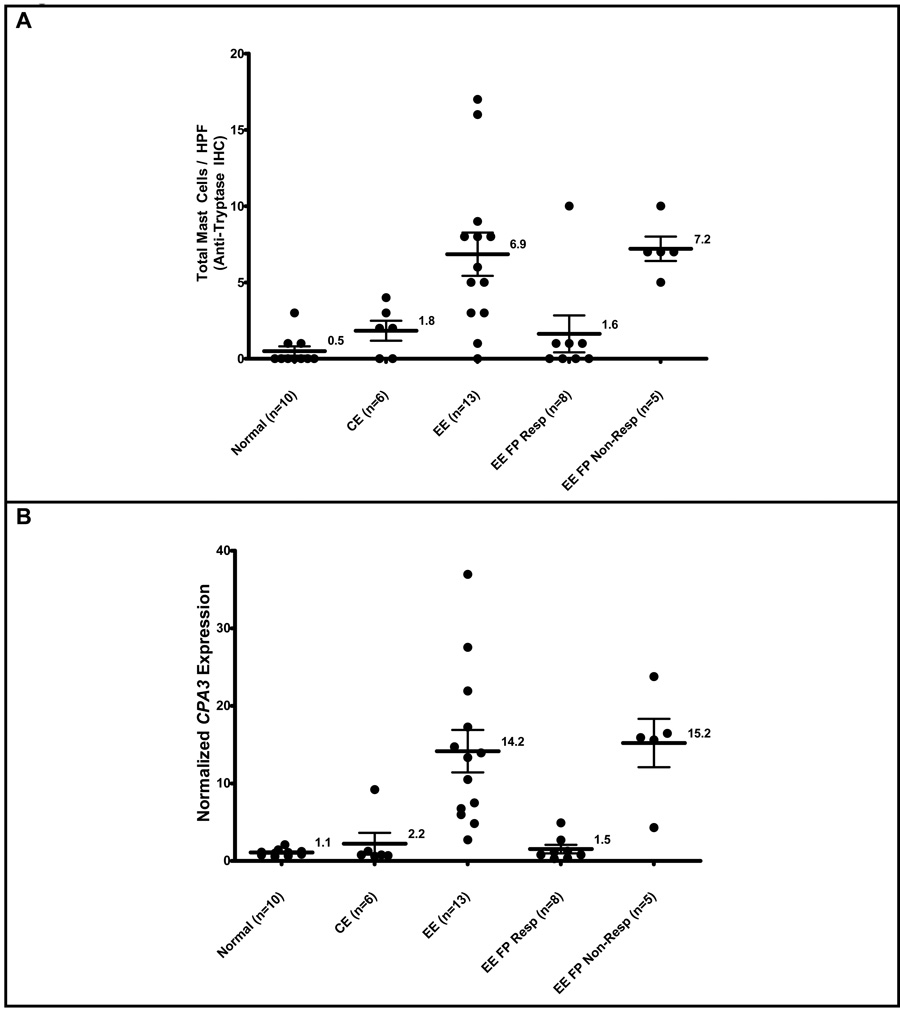
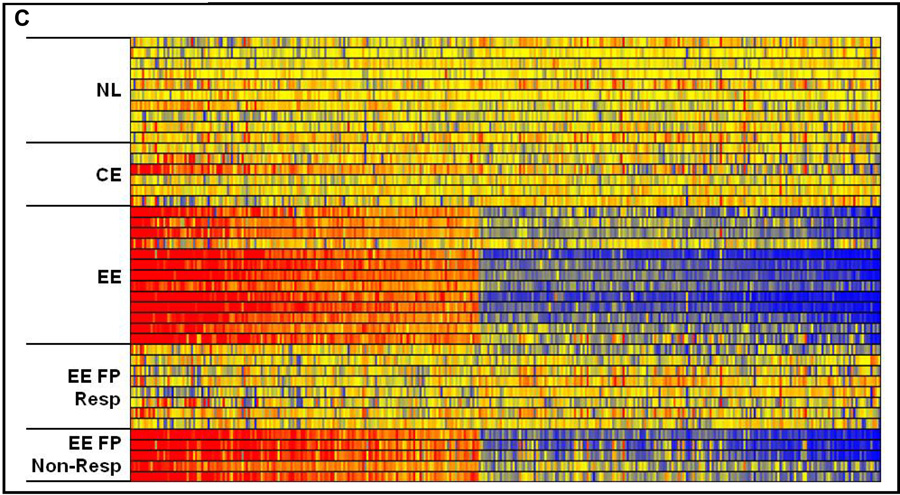
Results: Esophageal mastocytosis and mast cell degranulation were readily apparent in patients with EE compared with control subjects (P < .01), as assessed by staining for total mast cells and the presence of extracellular mast cell tryptase (P < .01). Microarray analysis revealed that mast cell levels correlated with the dysregulation of 0.8% (301 genes) of the genome, which was partially distinct from the genes that correlated with tissue eosinophilia. The expression of transcripts for the mast cell proteases carboxypeptidase A3 and tryptase, but not chymase, correlated with mast cell levels and distinguished patients with EE from control subjects. Suprabasilar mast cell counts (P < .01) and degranulation (P < .01) were proportional with KIT ligand mRNA expression. Treatment of patients with EE with swallowed fluticasone propionate normalized levels of mast cells and the mast cell-related transcriptome in responder patients.
Conclusion: Herein we have identified local mastocytosis and mast cell degranulation in the esophagi of patients with EE; identified an esophageal mast cell-associated transcriptome that is significantly divergent from the eosinophil-associated transcriptome, with carboxypeptidase A3 mRNA levels serving as the best mast cell surrogate marker; and provided evidence for the involvement of KIT ligand in the pathogenesis of EE.
Copyright 2010 American Academy of Allergy, Asthma & Immunology. Published by Mosby, Inc. All rights reserved.
Figures
References
-
- Noel RJ, Putnam PE, Rothenberg ME. Eosinophilic esophagitis. N Engl J Med. 2004;351:940–941. - PubMed
-
- Gill R, Durst P, Rewalt M, Elitsur Y. Eosinophilic esophagitis disease in children from West Virginia: a review of the last decade (1995–2004) Am J Gastroenterol. 2007;102:2281–2285. - PubMed
-
- Straumann A, Simon HU. Eosinophilic esophagitis: escalating epidemiology? J Allergy Clin Immunol. 2005;115:418–419. - PubMed
-
- Kelly KJ, Lazenby AJ, Rowe PC, Yardley JH, Perman JA, Sampson HA. Eosinophilic esophagitis attributed to gastroesophageal reflux: improvement with an amino acid-based formula. Gastroenterology. 1995;109:1503–1512. - PubMed
-
- Walsh SV, Antonioli DA, Goldman H, Fox VL, Bousvaros A, Leichtner AM, et al. Allergic esophagitis in children: a clinicopathological entity. Am J Surg Pathol. 1999;23:390–396. - PubMed
Publication types
MeSH terms
Substances
Grants and funding
- K08 AI057991/AI/NIAID NIH HHS/United States
- DK076893/DK/NIDDK NIH HHS/United States
- R01 AI083450/AI/NIAID NIH HHS/United States
- K12 HD028827/HD/NICHD NIH HHS/United States
- R01 AI045898/AI/NIAID NIH HHS/United States
- U19 AI070235/AI/NIAID NIH HHS/United States
- R01 DK076893/DK/NIDDK NIH HHS/United States
- AI070235/AI/NIAID NIH HHS/United States
- AI057991/AI/NIAID NIH HHS/United States
- P30 DK078392/DK/NIDDK NIH HHS/United States
- R37 AI045898/AI/NIAID NIH HHS/United States
- AI045898/AI/NIAID NIH HHS/United States
- 12HD028827/HD/NICHD NIH HHS/United States
- P30 HD028827/HD/NICHD NIH HHS/United States
LinkOut - more resources
Full Text Sources
Other Literature Sources
Medical
Miscellaneous
