

Type I interferon signals control Theiler's virus infection site, cellular infiltration and T cell stimulation in the CNS
- PMID: 20538350
- PMCID: PMC2937062
- DOI: 10.1016/j.jneuroim.2010.05.028
Type I interferon signals control Theiler's virus infection site, cellular infiltration and T cell stimulation in the CNS
Abstract
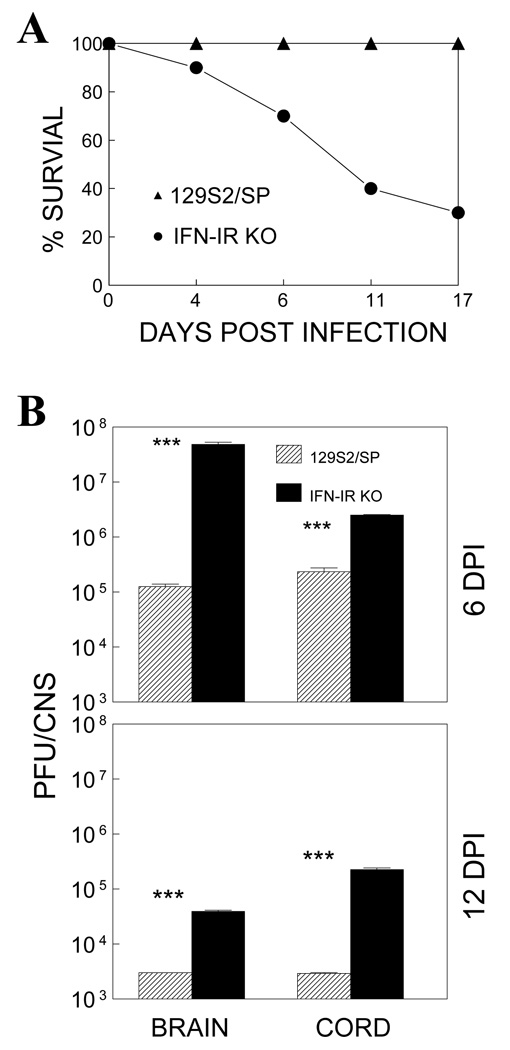
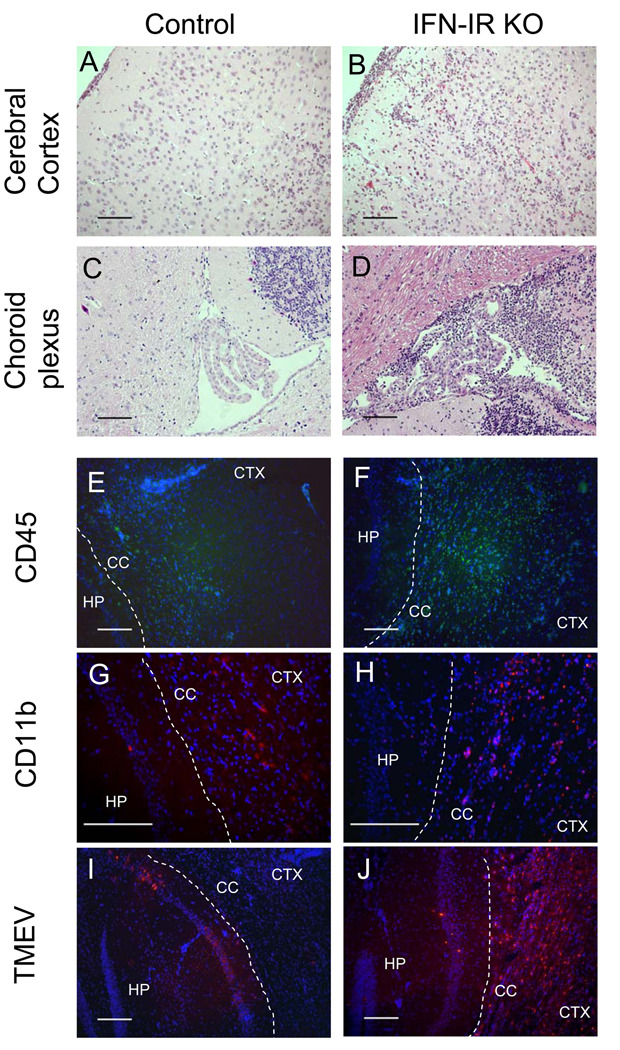
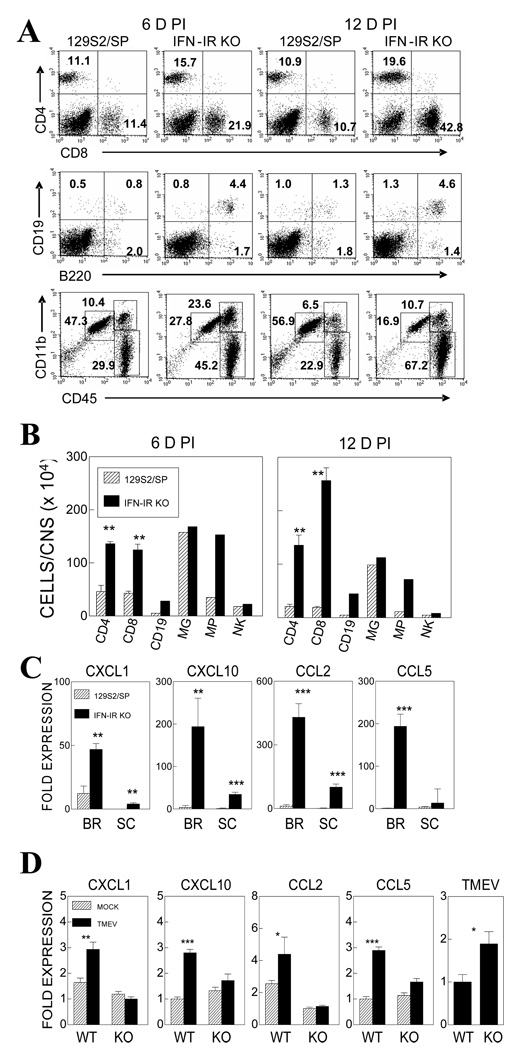
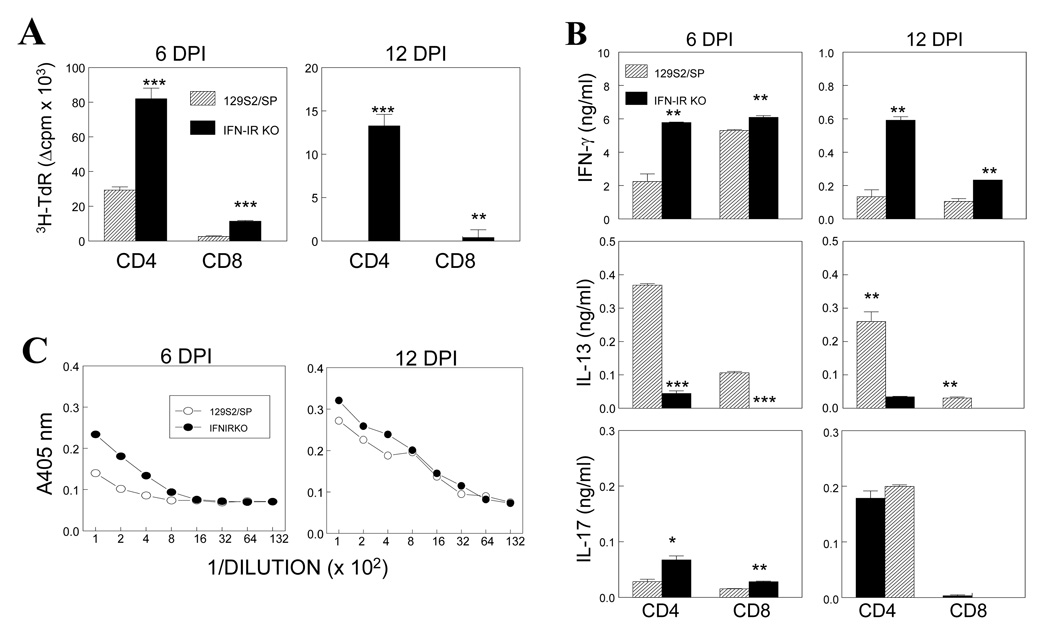
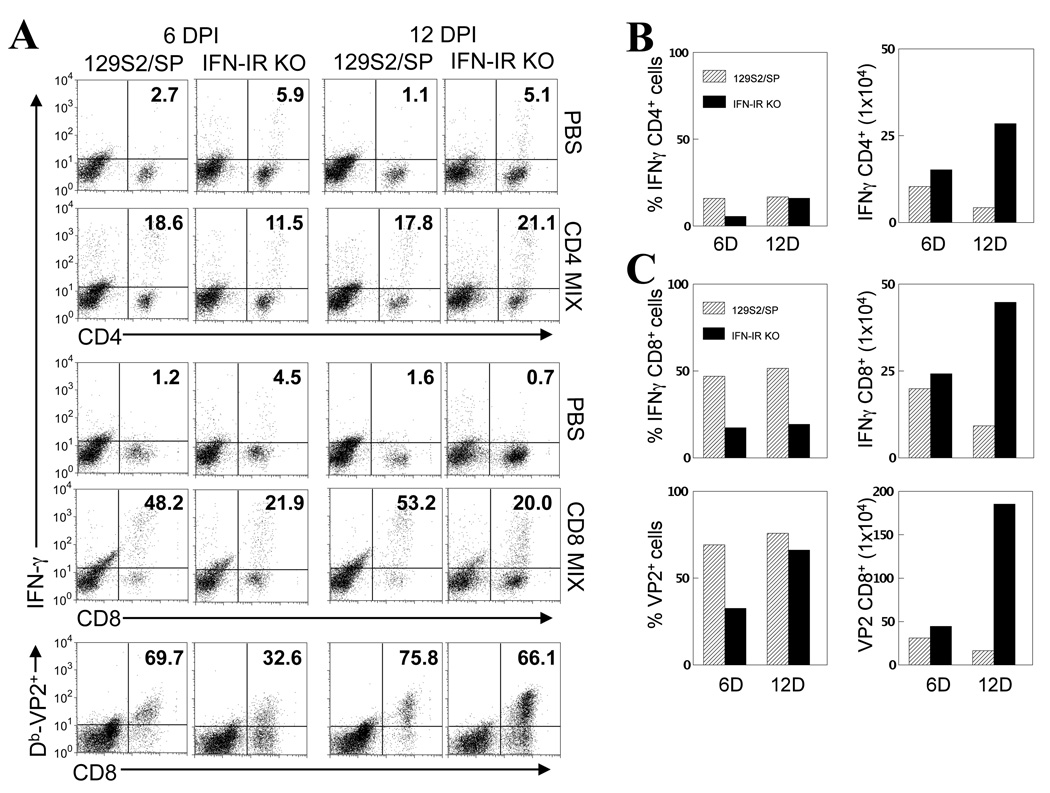
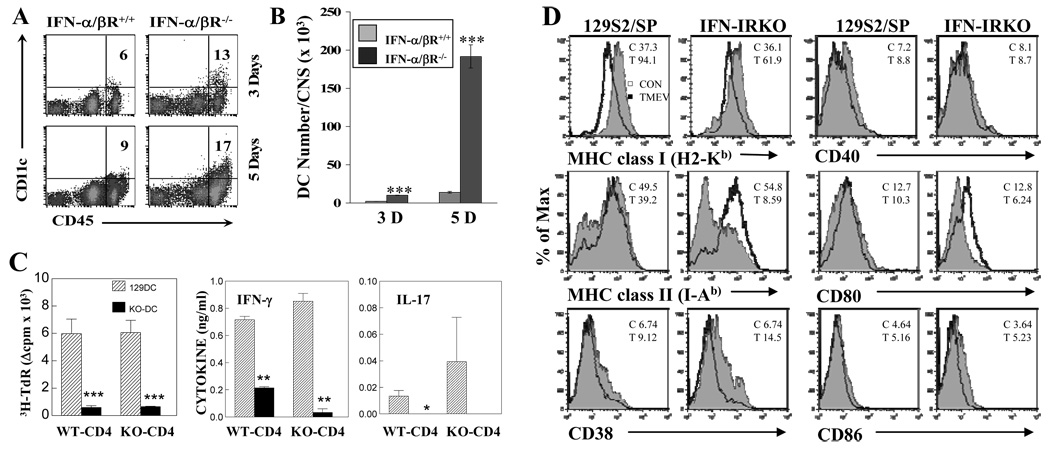
Theiler's murine encephalomyelitis virus (TMEV) establishes a persistent infection in the central nervous system (CNS). To examine the role of type I interferon (IFN-I)-mediated signals in TMEV infection, mice lacking a subunit of the type I IFN receptor (IFN-IR KO mice) were utilized. In contrast to wild type mice, IFN-IR KO mice developed rapid fatal encephalitis accompanied with greater viral load and infiltration of immune cells to the CNS. The proportion of virus-specific CD4(+) and CD8(+) T cell responses in the CNS was significantly lower in IFN-IR KO mice during the early stage of infection. Levels of IFN-γ and IL-17 produced by isolated primed CD4(+) T cells in response to DCs from TMEV-infected IFN-IR KO mice were also lower than those stimulated by DCs from TMEV-infected wild type control mice. The less efficient stimulation of virus-specific T cells by virus-infected antigen-presenting cells is attributable in part to the low level expression of activation markers on TMEV-infected cells from IFN-IR KO mice. However, due to high levels of cellular infiltration and viral loads in the CNS, the overall numbers of virus-specific T cells are higher in IFN-IR KO mice during the later stage of viral infection. These results suggest that IFN-I-mediated signals play important roles in controlling cellular infiltration to the CNS and shaping local T cell immune responses.
Copyright © 2010 Elsevier B.V. All rights reserved.
Figures
Similar articles
-
Excessive Innate Immunity Steers Pathogenic Adaptive Immunity in the Development of Theiler's Virus-Induced Demyelinating Disease.Int J Mol Sci. 2021 May 17;22(10):5254. doi: 10.3390/ijms22105254. Int J Mol Sci. 2021. PMID: 34067536 Free PMC article. Review.
-
CNS expression of B7-H1 regulates pro-inflammatory cytokine production and alters severity of Theiler's virus-induced demyelinating disease.PLoS One. 2011 Apr 8;6(4):e18548. doi: 10.1371/journal.pone.0018548. PLoS One. 2011. PMID: 21494618 Free PMC article.
-
IFNγ influences type I interferon response and susceptibility to Theiler's virus-induced demyelinating disease.Viral Immunol. 2013 Aug;26(4):223-38. doi: 10.1089/vim.2013.0004. Epub 2013 Jul 5. Viral Immunol. 2013. PMID: 23829778 Free PMC article.
-
The TIM-3 pathway ameliorates Theiler's murine encephalomyelitis virus-induced demyelinating disease.Int Immunol. 2014 Jul;26(7):369-81. doi: 10.1093/intimm/dxt056. Epub 2014 Jan 31. Int Immunol. 2014. PMID: 24486565
-
Theiler's virus-mediated autoimmunity: local presentation of CNS antigens and epitope spreading.Ann N Y Acad Sci. 2002 Apr;958:26-38. Ann N Y Acad Sci. 2002. PMID: 12021081 Review.
Cited by
-
Excessive Innate Immunity Steers Pathogenic Adaptive Immunity in the Development of Theiler's Virus-Induced Demyelinating Disease.Int J Mol Sci. 2021 May 17;22(10):5254. doi: 10.3390/ijms22105254. Int J Mol Sci. 2021. PMID: 34067536 Free PMC article. Review.
-
Facets of Theiler's Murine Encephalomyelitis Virus-Induced Diseases: An Update.Int J Mol Sci. 2019 Jan 21;20(2):448. doi: 10.3390/ijms20020448. Int J Mol Sci. 2019. PMID: 30669615 Free PMC article. Review.
-
TLR3 signaling is either protective or pathogenic for the development of Theiler's virus-induced demyelinating disease depending on the time of viral infection.J Neuroinflammation. 2011 Dec 21;8:178. doi: 10.1186/1742-2094-8-178. J Neuroinflammation. 2011. PMID: 22189096 Free PMC article.
-
Effects of Keratinocyte-Derived Cytokine (CXCL-1) on the Development of Theiler's Virus-Induced Demyelinating Disease.Front Cell Infect Microbiol. 2018 Jan 23;8:9. doi: 10.3389/fcimb.2018.00009. eCollection 2018. Front Cell Infect Microbiol. 2018. PMID: 29410948 Free PMC article.
-
Critical role of TLR activation in viral replication, persistence, and pathogenicity of Theiler's virus.Front Immunol. 2023 Apr 20;14:1167972. doi: 10.3389/fimmu.2023.1167972. eCollection 2023. Front Immunol. 2023. PMID: 37153539 Free PMC article. Review.
References
-
- Biron CA. Interferons alpha and beta as immune regulators--a new look. Immunity. 2001;14:661–664. - PubMed
-
- Biron CA, Nguyen KB, et al. Natural killer cells in antiviral defense: function and regulation by innate cytokines. Annu Rev Immunol. 1999;17:189–220. - PubMed
-
- Curtsinger JM, Valenzuela JO, et al. Type I IFNs provide a third signal to CD8 T cells to stimulate clonal expansion and differentiation. J Immunol. 2005;174:4465–4469. - PubMed
Publication types
MeSH terms
Substances
Grants and funding
LinkOut - more resources
Full Text Sources
Research Materials
