

Structural basis for capping protein sequestration by myotrophin (V-1)
- PMID: 20538588
- PMCID: PMC2919139
- DOI: 10.1074/jbc.M110.135848
Structural basis for capping protein sequestration by myotrophin (V-1)
Abstract
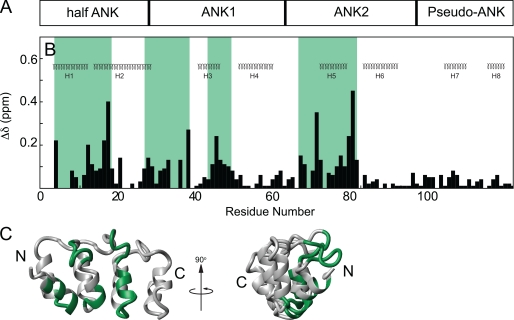
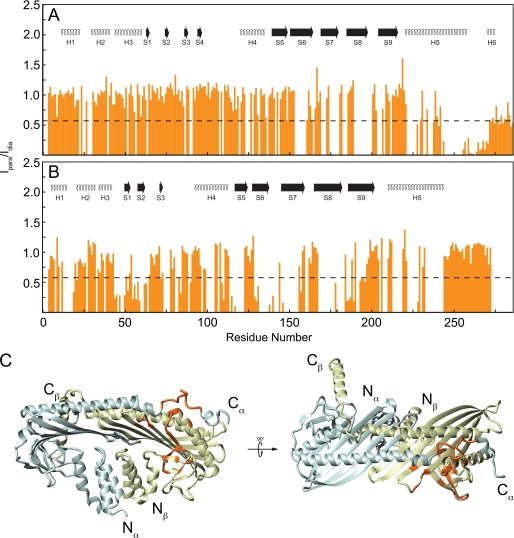
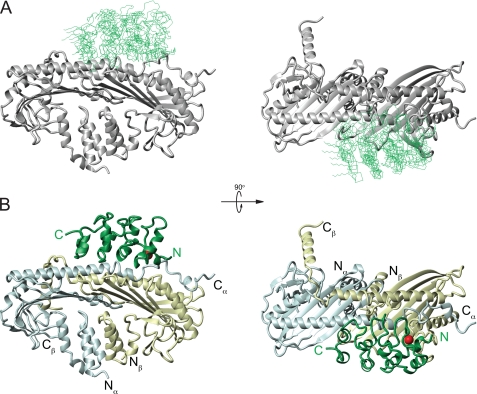
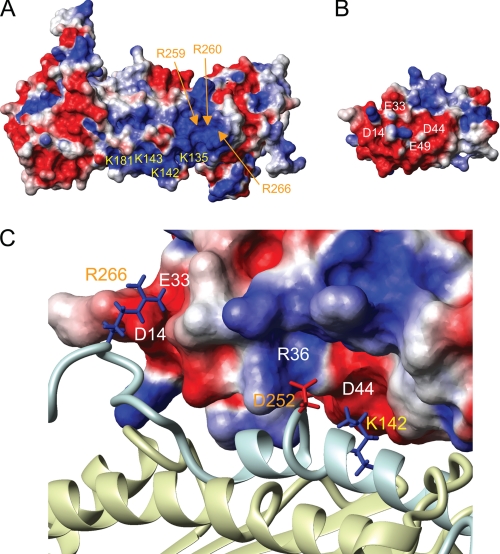
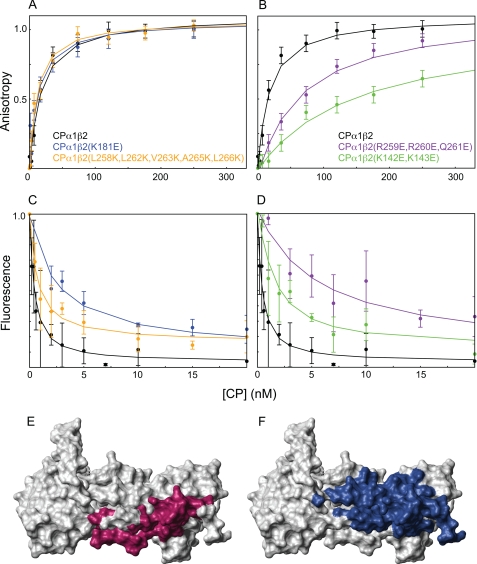
Capping protein (CP) is a ubiquitously expressed, heterodimeric 62-kDa protein that binds the barbed end of the actin filament with high affinity to block further filament elongation. Myotrophin (V-1) is a 13-kDa ankyrin repeat-containing protein that binds CP tightly, sequestering it in a totally inactive complex in vitro. Here, we elucidate the molecular interaction between CP and V-1 by NMR. Specifically, chemical shift mapping and intermolecular paramagnetic relaxation enhancement experiments reveal that the ankyrin loops of V-1, which are essential for V-1/CP interaction, bind the basic patch near the joint of the alpha tentacle of CP shown previously to drive most of the association of CP with and affinity for the barbed end. Consistently, site-directed mutagenesis of CP shows that V-1 and the strong electrostatic binding site for CP on the barbed end compete for this basic patch on CP. These results can explain how V-1 inactivates barbed end capping by CP and why V-1 is incapable of uncapping CP-capped actin filaments, the two signature biochemical activities of V-1.
Figures
Similar articles
-
Capping protein regulators fine-tune actin assembly dynamics.Nat Rev Mol Cell Biol. 2014 Oct;15(10):677-89. doi: 10.1038/nrm3869. Epub 2014 Sep 10. Nat Rev Mol Cell Biol. 2014. PMID: 25207437 Free PMC article. Review.
-
Binding of myotrophin/V-1 to actin-capping protein: implications for how capping protein binds to the filament barbed end.J Biol Chem. 2006 Oct 13;281(41):31021-30. doi: 10.1074/jbc.M606278200. Epub 2006 Aug 7. J Biol Chem. 2006. PMID: 16895918 Free PMC article.
-
Two distinct mechanisms for actin capping protein regulation--steric and allosteric inhibition.PLoS Biol. 2010 Jul 6;8(7):e1000416. doi: 10.1371/journal.pbio.1000416. PLoS Biol. 2010. PMID: 20625546 Free PMC article.
-
Molecular basis for barbed end uncapping by CARMIL homology domain 3 of mouse CARMIL-1.J Biol Chem. 2010 Sep 10;285(37):29014-26. doi: 10.1074/jbc.M110.134221. Epub 2010 Jul 13. J Biol Chem. 2010. PMID: 20630878 Free PMC article.
-
New insights into mechanism and regulation of actin capping protein.Int Rev Cell Mol Biol. 2008;267:183-206. doi: 10.1016/S1937-6448(08)00604-7. Int Rev Cell Mol Biol. 2008. PMID: 18544499 Free PMC article. Review.
Cited by
-
Structure and function of an atypical homodimeric actin capping protein from the malaria parasite.Cell Mol Life Sci. 2022 Feb 8;79(2):125. doi: 10.1007/s00018-021-04032-0. Cell Mol Life Sci. 2022. PMID: 35132495 Free PMC article.
-
Biophysical Mechanism of Allosteric Regulation of Actin Capping Protein.J Mol Biol. 2023 Dec 15;435(24):168342. doi: 10.1016/j.jmb.2023.168342. Epub 2023 Nov 2. J Mol Biol. 2023. PMID: 37924863 Free PMC article.
-
Allosteric Coupling of CARMIL and V-1 Binding to Capping Protein Revealed by Hydrogen-Deuterium Exchange.Cell Rep. 2018 May 29;23(9):2795-2804. doi: 10.1016/j.celrep.2018.04.096. Cell Rep. 2018. PMID: 29847807 Free PMC article.
-
Capping protein regulators fine-tune actin assembly dynamics.Nat Rev Mol Cell Biol. 2014 Oct;15(10):677-89. doi: 10.1038/nrm3869. Epub 2014 Sep 10. Nat Rev Mol Cell Biol. 2014. PMID: 25207437 Free PMC article. Review.
-
Conservation and divergence between cytoplasmic and muscle-specific actin capping proteins: insights from the crystal structure of cytoplasmic Cap32/34 from Dictyostelium discoideum.BMC Struct Biol. 2012 Jun 1;12:12. doi: 10.1186/1472-6807-12-12. BMC Struct Biol. 2012. PMID: 22657106 Free PMC article.
References
Publication types
MeSH terms
Substances
Associated data
- Actions
Grants and funding
LinkOut - more resources
Full Text Sources
Other Literature Sources
Molecular Biology Databases
Miscellaneous
