. 2010 Aug 13;285(33):25372-81.
doi: 10.1074/jbc.M110.148668. Epub 2010 Jun 10.

Genetic depletion of the malin E3 ubiquitin ligase in mice leads to lafora bodies and the accumulation of insoluble laforin

Affiliations

Genetic depletion of the malin E3 ubiquitin ligase in mice leads to lafora bodies and the accumulation of insoluble laforin

Anna A DePaoli-Roach et al. J Biol Chem. .

Abstract

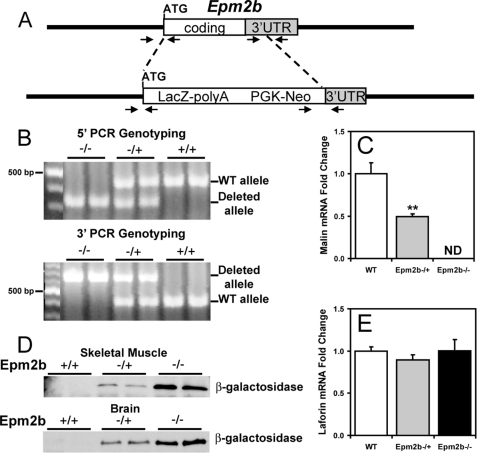
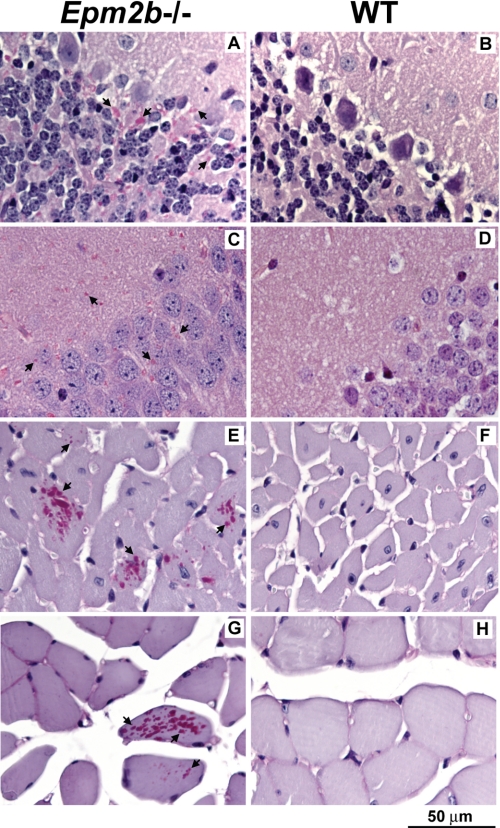
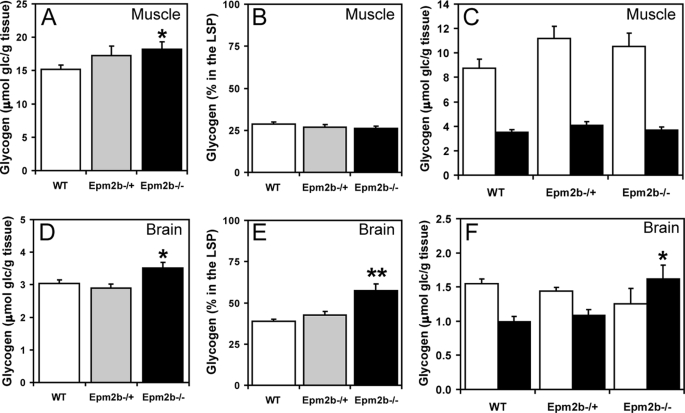
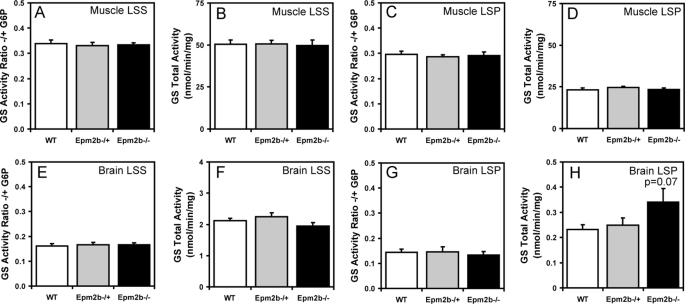
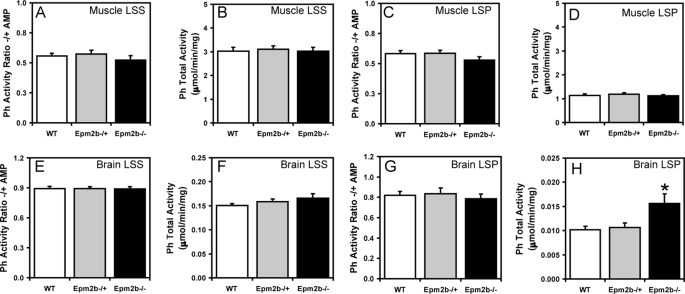
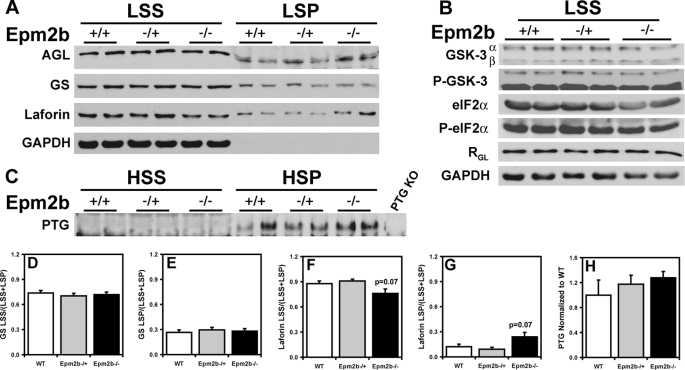
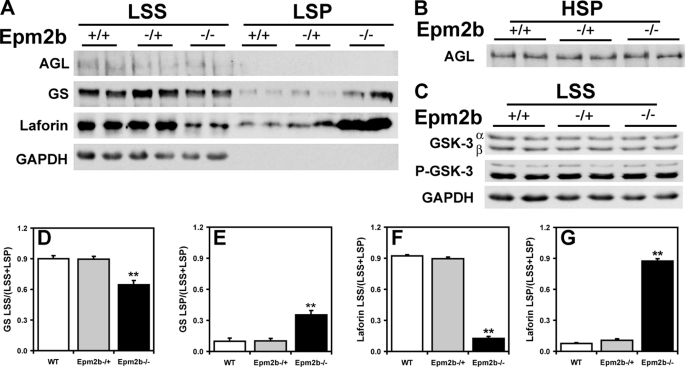
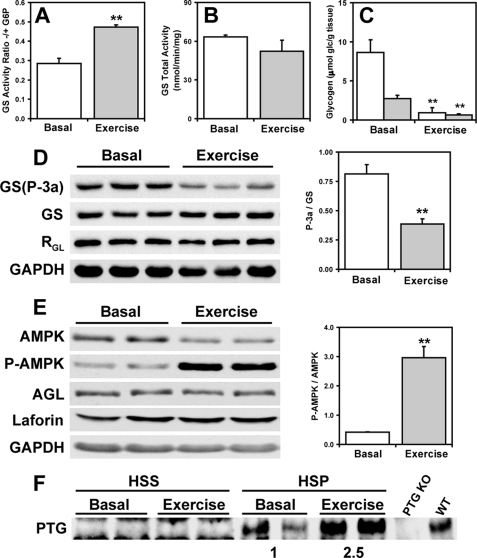
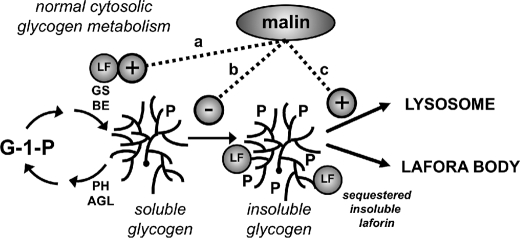
Approximately 90% of cases of Lafora disease, a fatal teenage-onset progressive myoclonus epilepsy, are caused by mutations in either the EPM2A or the EPM2B genes that encode, respectively, a glycogen phosphatase called laforin and an E3 ubiquitin ligase called malin. Lafora disease is characterized by the formation of Lafora bodies, insoluble deposits containing poorly branched glycogen or polyglucosan, in many tissues including skeletal muscle, liver, and brain. Disruption of the Epm2b gene in mice resulted in viable animals that, by 3 months of age, accumulated Lafora bodies in the brain and to a lesser extent in heart and skeletal muscle. Analysis of muscle and brain of the Epm2b(-/-) mice by Western blotting indicated no effect on the levels of glycogen synthase, PTG (type 1 phosphatase-targeting subunit), or debranching enzyme, making it unlikely that these proteins are targeted for destruction by malin, as has been proposed. Total laforin protein was increased in the brain of Epm2b(-/-) mice and, most notably, was redistributed from the soluble, low speed supernatant to the insoluble low speed pellet, which now contained 90% of the total laforin. This result correlated with elevated insolubility of glycogen and glycogen synthase. Because up-regulation of laforin cannot explain Lafora body formation, we conclude that malin functions to maintain laforin associated with soluble glycogen and that its absence causes sequestration of laforin to an insoluble polysaccharide fraction where it is functionally inert.


Figures

FIGURE 1.
FIGURE 1.
Targeted disruption of Epm2b. A, strategy for the disruption of the Epm2b gene. A diagram of the Epm2b locus and targeted disruption of the coding region is shown. Arrowheads indicate the position of the oligonucleotide primers used for PCR genotyping. UTR, untranslated region. B, 5′- and 3′-PCR genotyping. The wild type and the disrupted alleles are indicated. C and E, malin and laforin transcript levels. Malin and laforin mRNA levels were determined in skeletal muscle of 3-month-old mice as described under “Experimental Procedures.” n = 4. *, p < 0.01 versus WT. ND indicates not detectable. D, β-galactosidase expression. Shown is a representative Western blot of β-galactosidase expression in skeletal muscle and brain of WT, heterozygous, and homozygous null Epm2b mice (n = 8).
FIGURE 2.
FIGURE 2.
Lafora bodies in tissues of Epm2b−/− mice. Sections of brain, heart, and skeletal muscle were stained with periodic acid-Schiff/diastase to visualize α-amylase resistant polysaccharide, indicated by arrows. A, cerebellum, Epm2b−/−; B, cerebellum, wild type; C, hippocampus, Epm2b−/−; D, hippocampus, wild type; E, heart, Epm2b−/−; F, heart, wild type; G, soleus muscle, Epm2b−/−; H, soleus muscle, wild type.
FIGURE 3.
FIGURE 3.
Glycogen levels in skeletal muscle and brain of Epm2b−/− mice. A, total skeletal muscle glycogen levels, expressed as glucose (glc) equivalents per g of tissue. *, p < 0.05 versus WT (n = 8). B, the percentage of skeletal muscle glycogen in the LSP (n = 4). C, skeletal muscle glycogen levels in the LSS (open bars) and LSP (filled bars) (n = 4). D, total brain glycogen levels. *, p < 0.05 versus WT (n = 8). E, the percentage of brain glycogen in the LSP. **, p < 0.01 versus WT and Epm2b−/+ (n = 6). F, brain glycogen levels in the LSS (open bars) and LSP (filled bars). *, p < 0.05 versus WT LSP (n = 6).
FIGURE 4.
FIGURE 4.
Glycogen synthase activity in skeletal muscle and brain of Epm2b−/− mice. Skeletal muscle and brain from 3-month-old male WT, Epm2b−/+, and Epm2b−/− mice were analyzed. A, skeletal muscle GS −/+ G6P activity ratio in the LSS (n = 8). B, total skeletal muscle GS activity measured in the presence of G6P in the LSS (n = 8). C, skeletal muscle GS −/+ G6P activity ratio in the LSP (n = 8). D, total skeletal muscle GS activity in the LSP measured in the presence of G6P (n = 8). E, brain GS −/+ G6P activity ratio in the LSS (n = 8). F, total brain GS activity in the LSS measured in the presence of G6P (n = 8). G, brain GS activity ratio in the LSP −/+ G6P (n = 8). H, total brain GS activity in the LSP measured in the presence of G6P (n = 8).
FIGURE 5.
FIGURE 5.
Glycogen phosphorylase activity in skeletal muscle and brain of Epm2b−/− mice. Skeletal muscle and brain from 3-month-old male WT, Epm2b−/+, and Epm2b−/− mice were analyzed. A, skeletal muscle Ph −/+ AMP activity ratio in the LSS (n = 8). B, total skeletal muscle Ph activity in the LSS, measured in the presence of AMP (n = 8). C, skeletal muscle Ph −/+ AMP activity ratio in the LSP (n = 8). D, total skeletal muscle Ph activity in the LSP, measured in the presence of AMP (n = 8). E, brain Ph −/+ AMP activity ratio in the LSP (n = 8). F, total brain Ph activity in the LSS, measured in the presence of AMP (n = 8). G, brain Ph −/+ AMP activity ratio in the LSP (n = 8). H, total brain Ph activity in the LSP, measured in the presence of AMP. *, p < 0.05 versus WT (n = 8).
FIGURE 6.
FIGURE 6.
Glycogen-metabolizing enzymes and related proteins in skeletal muscle of Epm2b−/− mice. Skeletal muscle from 3-month-old male WT, Epm2b−/+, and Epm2b−/− mice was analyzed. A, distribution of AGL, GS, and laforin protein levels in skeletal muscle LSS and LSP. Representative Western blots are shown from n = 8. Comparable amounts of samples of the LSS and LSP were loaded. GAPDH, glyceraldehyde-3-phosphate dehydrogenase. B, GSK-3, phospho-GSK-3 (P-GSK-3), eIF2α, phospho-eIF2α (P-eIF2α), and RGL protein levels in the LSS. Representative Western blots are shown from n = 4. Comparable amounts of samples were loaded. Glyceraldehyde-3-phosphate dehydrogenase was used as loading control. C, PTG protein levels in the HSS and the HSP. Samples in the HSP pellet were enriched five times with respect to the HSS to allow detection. KO, knock-out. D, quantitation of GS protein levels in the LSS, expressed as the ratio of protein in the LSS to the total protein (LSS + LSP) (n = 8). E, quantitation of GS protein levels in the LSP, expressed as the ratio of protein in the LSS to the total protein (LSS + LSP) (n = 8). F, quantitation of laforin protein levels in the LSS, expressed as the ratio of protein in the LSS to the total protein (LSS + LSP) (n = 8). G, quantitation of laforin protein levels in the LSP, expressed as the ratio of protein in the LSS to the total protein (LSS + LSP) (n = 8). H, quantitation of PTG protein levels in the HSP normalized to WT protein levels (n = 4).
FIGURE 7.
FIGURE 7.
Glycogen-metabolizing enzymes and related proteins in brain of Epm2b−/− mice. Skeletal muscle from 3-month-old male WT, Epm2b+/−, and Epm2b−/− mice was analyzed. A, distribution of AGL, GS, and laforin protein levels in brain LSS and LSP. Representative Western blots are shown from n = 5–8). LSP of AGL and GS are enriched ∼2.5-fold as compared with LSS because of the low protein concentration in the pellet fraction, whereas LSP of laforin are enriched only by 50%. GAPDH, glyceraldehyde-3-phosphate dehydrogenase. B, AGL protein levels in the HSP enriched 2.5-fold with respect to the LSS (n = 4). C, GSK-3 and phospho-GSK-3 (P-GSK-3) protein levels in the LSS (n = 4). D, quantitation of GS protein levels in the LSS, expressed as the ratio of protein in the LSS to the total protein (LSS + LSP). **, p = 0.0002 (n = 8), normalized for equal sample loading. E, quantitation of GS protein levels in the LSP, expressed as the ratio of protein in the LSS to the total protein (LSS + LSP), normalized for equal sample loading. **, p = 0.0002 (n = 8). F, quantitation of laforin protein levels in the LSS, expressed as the ratio of protein in the LSS to the total protein (LSS + LSP). **, p < 0.0001 (n = 5), normalized for equal sample loading. G, quantitation of laforin protein levels in the LSP, expressed as the ratio of protein in the LSS to the total protein (LSS + LSP). **, p < 0.0001 (n = 5), normalized for equal sample loading.
FIGURE 8.
FIGURE 8.
Effect of AMPK activation on glycogen-metabolizing enzymes and related proteins in skeletal muscle of exercised mice. Skeletal muscle of 3-month-old WT male mice exercised to exhaustion was analyzed. A, GS −/+ G6P activity ratio in the LSS of basal and exercised mice. **, p < 0.01 (n = 3). B, total GS activity in the LSS measured in the presence of G6P of basal and exercised mice (n = 3). C, skeletal muscle glycogen levels in the LSS (open bars) and LSP (filled bars) of basal and exercised mice (n = 3). D, Western blots of phosphorylated GS (site 3a) (GS-P-3a), total GS, and RGL in basal and exercised mice and quantitation of GS site 3a phosphorylation **, p < 0.01 (n = 3). GAPDH, glyceraldehyde-3-phosphate dehydrogenase. E, Western blots of phosphorylated AMPK (P-AMPK), total AMPK, AGL, and laforin and quantitation of AMPK phosphorylation in basal and exercised mice **, p < 0.01 (n = 3). F, PTG protein levels in the HSS and HSP of basal and exercised mice. HSP samples are enriched 4-fold with respect to the HSS. KO, knock-out.
FIGURE 9.
FIGURE 9.
Possible roles for malin in glycogen metabolism. Normal, cytosolic glycogen metabolism involves synthesis by GS and branching enzyme (BE) and degradation by Ph and debranching enzyme (AGL). In this model, active, soluble laforin (LF) is viewed as a necessary component of normal glycogen metabolism, preventing hyperphosphorylation that can lead to insoluble, poorly branched glycogen. Malin could act positively to up-regulate or at least maintain soluble laforin activity simply by forming a complex with laforin or by some other mechanism (pathway a). An alternative possibility would be prevention of the formation of aberrantly structured glycogen by an as yet unknown pathway independent of laforin (pathway b). Finally, malin might act to promote the lysosomal disposal of any aberrantly structured glycogen as it is formed (pathway c).

Similar articles

Cited by

References

    1. Delgado-Escueta A. V. (2007) Curr. Neurol. Neurosci. Rep. 7, 428–433 - PubMed
    1. Gentry M. S., Dixon J. E., Worby C. A. (2009) Trends Biochem. Sci. 34, 628–639 - PMC - PubMed
    1. Ganesh S., Puri R., Singh S., Mittal S., Dubey D. (2006) J. Hum. Genet. 51, 1–8 - PubMed
    1. Ramachandran N., Girard J. M., Turnbull J., Minassian B. A. (2009) Epilepsia 50, Suppl. 5, 29–36 - PubMed
    1. Roach P. J. (2002) Curr. Mol. Med. 2, 101–120 - PubMed

Publication types

MeSH terms