. 2010 Aug;20(8):1020-36.
doi: 10.1101/gr.103341.109. Epub 2010 Jun 10.

Systematic genetic and genomic analysis of cytochrome P450 enzyme activities in human liver

Affiliations

Systematic genetic and genomic analysis of cytochrome P450 enzyme activities in human liver

Xia Yang et al. Genome Res. 2010 Aug.

Abstract

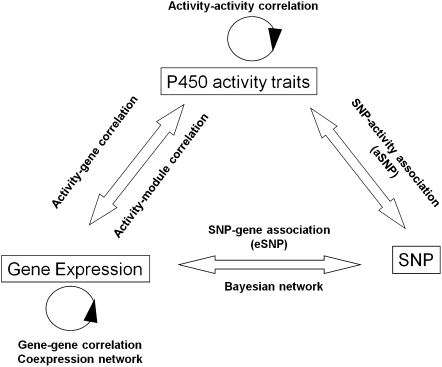
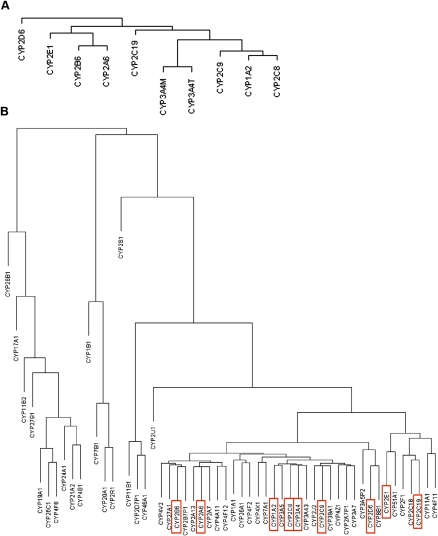
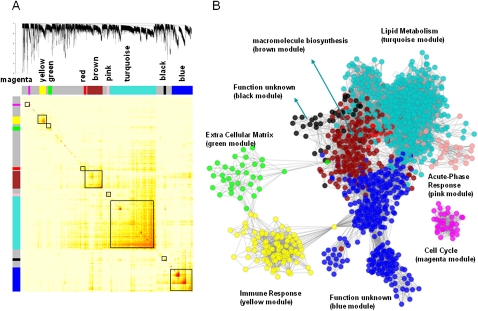
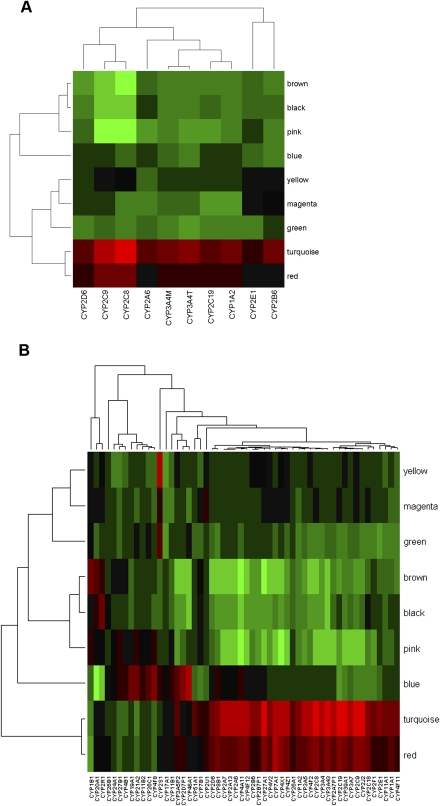
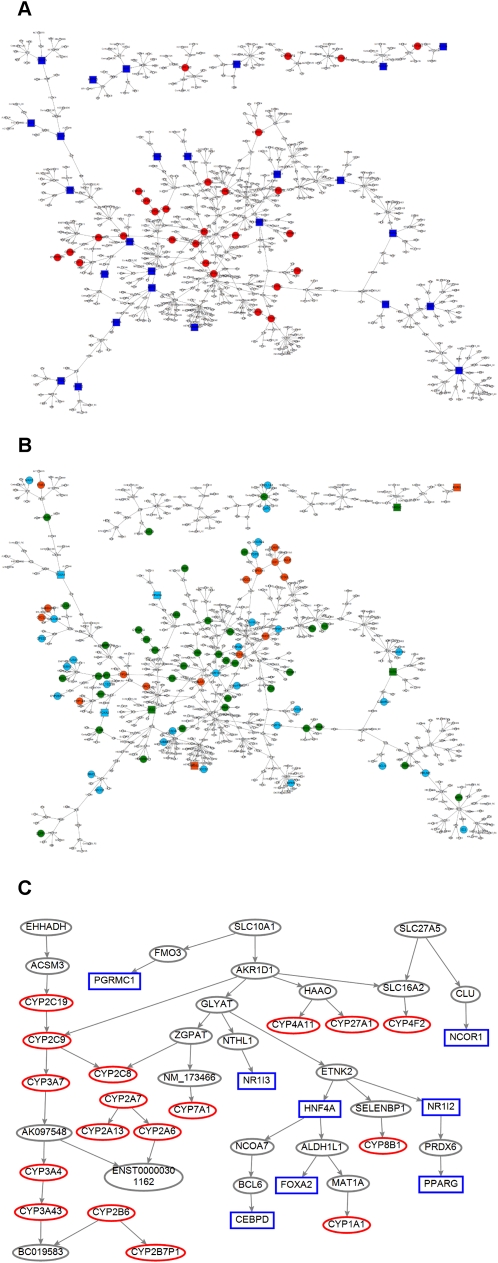
Liver cytochrome P450s (P450s) play critical roles in drug metabolism, toxicology, and metabolic processes. Despite rapid progress in the understanding of these enzymes, a systematic investigation of the full spectrum of functionality of individual P450s, the interrelationship or networks connecting them, and the genetic control of each gene/enzyme is lacking. To this end, we genotyped, expression-profiled, and measured P450 activities of 466 human liver samples and applied a systems biology approach via the integration of genetics, gene expression, and enzyme activity measurements. We found that most P450s were positively correlated among themselves and were highly correlated with known regulators as well as thousands of other genes enriched for pathways relevant to the metabolism of drugs, fatty acids, amino acids, and steroids. Genome-wide association analyses between genetic polymorphisms and P450 expression or enzyme activities revealed sets of SNPs associated with P450 traits, and suggested the existence of both cis-regulation of P450 expression (especially for CYP2D6) and more complex trans-regulation of P450 activity. Several novel SNPs associated with CYP2D6 expression and enzyme activity were validated in an independent human cohort. By constructing a weighted coexpression network and a Bayesian regulatory network, we defined the human liver transcriptional network structure, uncovered subnetworks representative of the P450 regulatory system, and identified novel candidate regulatory genes, namely, EHHADH, SLC10A1, and AKR1D1. The P450 subnetworks were then validated using gene signatures responsive to ligands of known P450 regulators in mouse and rat. This systematic survey provides a comprehensive view of the functionality, genetic control, and interactions of P450s.


Figures

Figure 1.
Figure 1.
Data sets collected and analysis scheme of the current study. The three data sets (P450 activity traits, gene expression, SNP genotyping) are shown in rectangles. The data analyses conducted are labeled above, below, or between the data sets. These include (1) activity–activity correlation among enzyme activity measures, (2) gene–gene correlation among gene expression levels, (3) activity–gene correlation between genes and activity levels, (4) coexpression network construction based on expression levels, (5) activity–module correlation between activity measurements and coexpression modules, (6) SNP–gene association (expression SNP or eSNP) between genotype and gene expression, (7) SNP–activity association (activity SNP or aSNP) between genotype and enzyme activity, and (8) Bayesian network construction based on both expression and genotype data.
Figure 2.
Figure 2.
Dendrograms of the hierarchical clustering between P450s. (A) Dendrogram of the P450 enzyme activity traits. (B) Dendrogram of the P450 gene expression traits. The coding genes for the P450 enzymes shown in A are highlighted in red rectangles in B.
Figure 3.
Figure 3.
The HLC coexpression network and corresponding gene modules. (A) A topological overlap matrix of the gene coexpression network consisting of the top 12.5% most differentially expressed genes (5012 expression traits) identifies individual modules (boxed). Genes in the rows and columns are sorted by an agglomerative hierarchical clustering algorithm. The different shades of color signify the strength of the connections between the nodes (from white, signifying not significantly correlated, to red, signifying highly significantly correlated). The hierarchical clustering and the topological overlap matrix strongly indicate highly interconnected subsets of genes (modules). Modules identified are colored along both column and row and are boxed. (B) The corresponding graph of the HLC coexpression network. The colors of the nodes represent their module assignments as described in A. Pathway enrichment terms are assigned to individual modules.
Figure 4.
Figure 4.
Module relevance to various P450 traits of interest. To examine how each gene module is related to P450 enzyme activity/gene expression level, we performed principal component analysis (PCA) for each module and then took as module relevance the value of the correlation between the first principal component (module eigengene) and the enzyme measure. (A) Clustering analysis on the module relevance to P450 enzyme activities; (B) Clustering analysis on the module relevance to P450 gene expression. Red color indicates positive correlation, and green represents negative correlation. The turquoise module is most significantly (P-value < 0.001) positively correlated with the expression of many of the P450 genes and all P450 enzyme activity measurements except for CYP2E1. Three other modules—namely, the red, pink, and brown modules—are also significantly correlated with both the enzyme activity and gene expression levels of many P450s (P-value < 0.05), although the specificity for P450s vary among these modules.
Figure 5.
Figure 5.
P450 gene regulatory Bayesian subnetwork. (A) A P450 gene regulatory subnetwork composed of both the P450 genes and the genes that are two-edges away from any P450 gene. P450 genes and the known P450 regulators in the subnetwork are highlighted as red circles and blue squares, respectively. (B) The same subnetwork highlighted with liver genes responsive to ligands of known regulators of P450s, namely, AHR, CAR, or PXR (Slatter et al. 2006) in mouse (cyan nodes), rat (green nodes), and both species (red nodes). (C) A pruned P450 subnetwork composed of the key regulators identified in A and their downstream P450 targets. The known regulators and P450 genes are shown as blue rectangles and red ovals, respectively.

References

    1. Adonis M, Martinez V, Marin P, Berrios D, Gil L 2005. Smoking habit and genetic factors associated with lung cancer in a population highly exposed to arsenic. Toxicol Lett 159: 32–37 - PubMed
    1. Aguiar M, Masse R, Gibbs BF 2005. Regulation of cytochrome P450 by posttranslational modification. Drug Metab Rev 37: 379–404 - PubMed
    1. Ahluwalia A, Clodfelter KH, Waxman DJ 2004. Sexual dimorphism of rat liver gene expression: Regulatory role of growth hormone revealed by deoxyribonucleic acid microarray analysis. Mol Endocrinol 18: 747–760 - PubMed
    1. Aitken AE, Richardson TA, Morgan ET 2006. Regulation of drug-metabolizing enzymes and transporters in inflammation. Annu Rev Pharmacol Toxicol 46: 123–149 - PubMed
    1. Anderson GD 2008. Gender differences in pharmacological response. Int Rev Neurobiol 83: 1–10 - PubMed

Publication types

MeSH terms

Substances