Paired associative stimulation induces change in presynaptic inhibition of Ia terminals in wrist flexors in humans
- PMID: 20538768
- PMCID: PMC2934933
- DOI: 10.1152/jn.00761.2009
Paired associative stimulation induces change in presynaptic inhibition of Ia terminals in wrist flexors in humans
Abstract
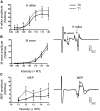
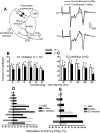
Enhancements in the strength of corticospinal projections to muscles are induced in conscious humans by paired associative stimulation (PAS) to the motor cortex. Although most of the previous studies support the hypothesis that the increase of the amplitude of motor evoked potentials (MEPs) by PAS involves long-term potentiation (LTP)-like mechanism in cortical synapses, changes in spinal excitability after PAS have been reported, suggestive of parallel modifications in both cortical and spinal excitability. In a first series of experiments (experiment 1), we confirmed that both flexor carpi radialis (FCR) MEPs and FCR H reflex recruitment curves are enhanced by PAS. To elucidate the mechanism responsible for this change in the H reflex amplitude, we tested, using the same subjects, the hypothesis that enhanced H reflexes are caused by a down-regulation of the efficacy of mechanisms controlling Ia afferent discharge, including presynaptic Ia inhibition and postactivation depression. To address this question, amounts of both presynaptic Ia inhibition of FCR Ia terminals (D1 and D2 inhibitions methods; experiment 2) and postactivation depression (experiment 3) were determined before and after PAS. Results showed that PAS induces a significant decrease of presynaptic Ia inhibition of FCR terminals, which was concomitant with the facilitation of the H reflex. Postactivation depression was unaffected by PAS. It is argued that enhancement of segmental excitation by PAS relies on a selective effect of PAS on the interneurons controlling presynaptic inhibition of Ia terminals.
Figures


Similar articles
-
Modulation of presynaptic inhibition of la afferents during voluntary wrist flexion and extension in man.Exp Brain Res. 2001 Mar;137(1):127-31. doi: 10.1007/s002210000662. Exp Brain Res. 2001. PMID: 11310168
-
Impact of precision grip tasks on cervical spinal network excitability in humans.J Physiol. 2011 Jul 15;589(Pt 14):3545-58. doi: 10.1113/jphysiol.2011.206268. Epub 2011 May 23. J Physiol. 2011. PMID: 21606115 Free PMC article.
-
Paired associative transspinal and transcortical stimulation produces plasticity in human cortical and spinal neuronal circuits.J Neurophysiol. 2016 Aug 1;116(2):904-16. doi: 10.1152/jn.00259.2016. Epub 2016 Jun 8. J Neurophysiol. 2016. PMID: 27281748 Free PMC article.
-
On the comparability of H-reflexes and MEPs.Electroencephalogr Clin Neurophysiol Suppl. 1999;51:93-101. Electroencephalogr Clin Neurophysiol Suppl. 1999. PMID: 10590939 Review. No abstract available.
-
Hypothesis: Hughlings Jackson and presynaptic inhibition: is there a big picture?J Neurophysiol. 2016 Jul 1;116(1):41-50. doi: 10.1152/jn.00371.2015. Epub 2016 Apr 27. J Neurophysiol. 2016. PMID: 27121579 Free PMC article. Review.
Cited by
-
Neurophysiological Changes After Paired Brain and Spinal Cord Stimulation Coupled With Locomotor Training in Human Spinal Cord Injury.Front Neurol. 2021 May 10;12:627975. doi: 10.3389/fneur.2021.627975. eCollection 2021. Front Neurol. 2021. PMID: 34040572 Free PMC article.
-
Cerebellar processing of sensory inputs primes motor cortex plasticity.Cereb Cortex. 2013 Feb;23(2):305-14. doi: 10.1093/cercor/bhs016. Epub 2012 Feb 20. Cereb Cortex. 2013. PMID: 22351647 Free PMC article.
-
A hierarchy of corticospinal plasticity in human hand and forearm muscles.J Physiol. 2019 May;597(10):2729-2739. doi: 10.1113/JP277462. Epub 2019 Mar 20. J Physiol. 2019. PMID: 30839110 Free PMC article.
-
Paired Stimulation of Different Digits for 30 min Does Not Produce Long-Term Plastic Changes in the Human Cutaneomuscular Reflex.eNeuro. 2025 Mar 20;12(3):ENEURO.0103-24.2024. doi: 10.1523/ENEURO.0103-24.2024. Print 2025 Mar. eNeuro. 2025. PMID: 40113256 Free PMC article.
-
Brain and spinal cord paired stimulation coupled with locomotor training affects polysynaptic flexion reflex circuits in human spinal cord injury.Exp Brain Res. 2022 Jun;240(6):1687-1699. doi: 10.1007/s00221-022-06375-x. Epub 2022 May 6. Exp Brain Res. 2022. PMID: 35513720 Free PMC article. Clinical Trial.
References
-
- Anden NE, Jukes MG, Lundberg A, Vyklicky L. The effect of DOPA on the spinal cord. 1. Influence on transmission from primary afferents. Acta Physiol Scand 67: 373–386, 1966 - PubMed
-
- Aymard C, Baret M, Katz R, Lafitte C, Penicaud A, Raoul S. Modulation of presynaptic inhibition of la afferents during voluntary wrist flexion and extension in man. Exp Brain Res 137: 127–131, 2001 - PubMed
-
- Carp JS, Chen XY, Sheikh H, Wolpaw JR. Operant conditioning of rat H-reflex affects motoneuron axonal conduction velocity. Exp Brain Res 136: 269–273, 2001 - PubMed
Publication types
MeSH terms
Grants and funding
LinkOut - more resources
Full Text Sources
Medical

