

Surface-based information mapping reveals crossmodal vision-action representations in human parietal and occipitotemporal cortex
- PMID: 20538772
- PMCID: PMC2934920
- DOI: 10.1152/jn.00326.2010
Surface-based information mapping reveals crossmodal vision-action representations in human parietal and occipitotemporal cortex
Abstract
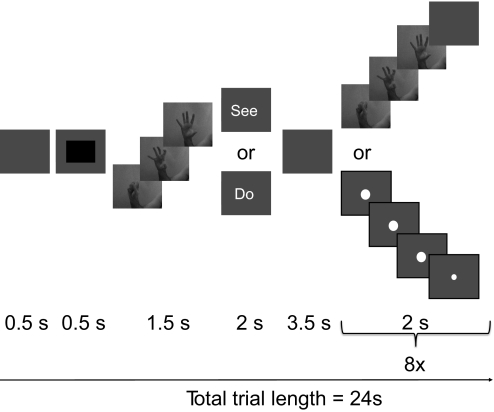
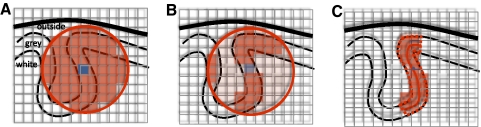
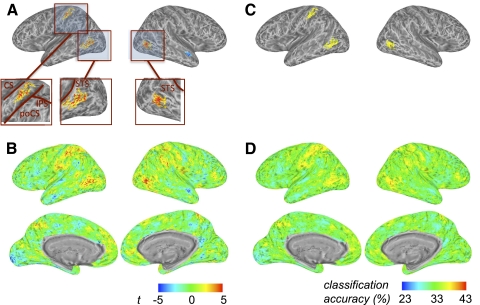
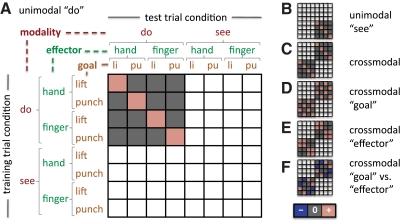
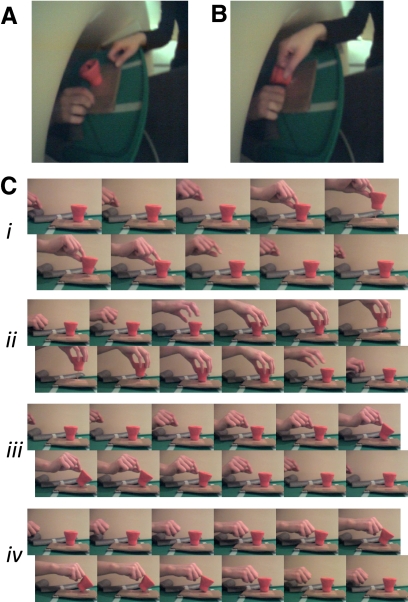
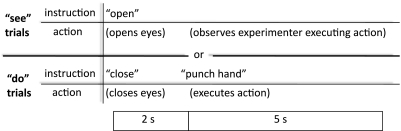
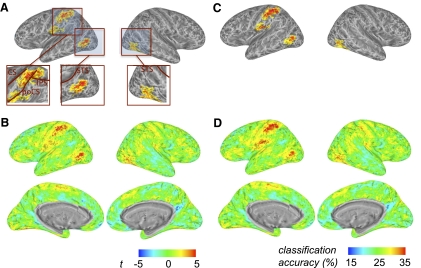
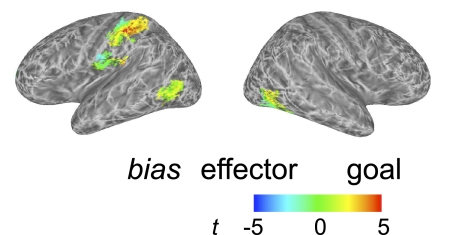
Many lines of evidence point to a tight linkage between the perceptual and motoric representations of actions. Numerous demonstrations show how the visual perception of an action engages compatible activity in the observer's motor system. This is seen for both intransitive actions (e.g., in the case of unconscious postural imitation) and transitive actions (e.g., grasping an object). Although the discovery of "mirror neurons" in macaques has inspired explanations of these processes in human action behaviors, the evidence for areas in the human brain that similarly form a crossmodal visual/motor representation of actions remains incomplete. To address this, in the present study, participants performed and observed hand actions while being scanned with functional MRI. We took a data-driven approach by applying whole-brain information mapping using a multivoxel pattern analysis (MVPA) classifier, performed on reconstructed representations of the cortical surface. The aim was to identify regions in which local voxelwise patterns of activity can distinguish among different actions, across the visual and motor domains. Experiment 1 tested intransitive, meaningless hand movements, whereas experiment 2 tested object-directed actions (all right-handed). Our analyses of both experiments revealed crossmodal action regions in the lateral occipitotemporal cortex (bilaterally) and in the left postcentral gyrus/anterior parietal cortex. Furthermore, in experiment 2 we identified a gradient of bias in the patterns of information in the left hemisphere postcentral/parietal region. The postcentral gyrus carried more information about the effectors used to carry out the action (fingers vs. whole hand), whereas anterior parietal regions carried more information about the goal of the action (lift vs. punch). Taken together, these results provide evidence for common neural coding in these areas of the visual and motor aspects of actions, and demonstrate further how MVPA can contribute to our understanding of the nature of distributed neural representations.
Figures
Similar articles
-
Multisensory perception of action in posterior temporal and parietal cortices.Neuropsychologia. 2011 Jan;49(1):108-14. doi: 10.1016/j.neuropsychologia.2010.10.030. Epub 2010 Oct 29. Neuropsychologia. 2011. PMID: 21036183 Free PMC article.
-
MEG Multivariate Analysis Reveals Early Abstract Action Representations in the Lateral Occipitotemporal Cortex.J Neurosci. 2015 Dec 9;35(49):16034-45. doi: 10.1523/JNEUROSCI.1422-15.2015. J Neurosci. 2015. PMID: 26658857 Free PMC article.
-
Representational content of occipitotemporal and parietal tool areas.Neuropsychologia. 2016 Apr;84:81-8. doi: 10.1016/j.neuropsychologia.2015.09.001. Epub 2015 Sep 3. Neuropsychologia. 2016. PMID: 26344476
-
A Tale of Two Visual Systems: Invariant and Adaptive Visual Information Representations in the Primate Brain.Annu Rev Vis Sci. 2018 Sep 15;4:311-336. doi: 10.1146/annurev-vision-091517-033954. Epub 2018 Jun 27. Annu Rev Vis Sci. 2018. PMID: 29949722 Review.
-
Topographical Representation of Saliency in the Human Visual and Temporo-occipital Cortex.J Neurosci. 2024 May 8;44(19):e0037242024. doi: 10.1523/JNEUROSCI.0037-24.2024. J Neurosci. 2024. PMID: 38719457 Free PMC article. Review. No abstract available.
Cited by
-
Searchlight analysis: promise, pitfalls, and potential.Neuroimage. 2013 Sep;78:261-9. doi: 10.1016/j.neuroimage.2013.03.041. Epub 2013 Apr 1. Neuroimage. 2013. PMID: 23558106 Free PMC article.
-
The influence of visual training on predicting complex action sequences.Hum Brain Mapp. 2013 Feb;34(2):467-86. doi: 10.1002/hbm.21450. Epub 2011 Nov 18. Hum Brain Mapp. 2013. PMID: 22102260 Free PMC article.
-
The brain network underlying the recognition of hand gestures in the blind: the supramodal role of the extrastriate body area.J Neurosci. 2014 Jul 23;34(30):10096-108. doi: 10.1523/JNEUROSCI.0500-14.2014. J Neurosci. 2014. PMID: 25057211 Free PMC article. Clinical Trial.
-
Comparing the similarity and spatial structure of neural representations: a pattern-component model.Neuroimage. 2011 Apr 15;55(4):1665-78. doi: 10.1016/j.neuroimage.2011.01.044. Epub 2011 Jan 20. Neuroimage. 2011. PMID: 21256225 Free PMC article.
-
The neural representation of body part concepts.Cereb Cortex. 2024 Jun 4;34(6):bhae213. doi: 10.1093/cercor/bhae213. Cereb Cortex. 2024. PMID: 38863113 Free PMC article.
References
-
- Agnew ZK, Bhakoo KK, Puri BK. The human mirror system: a motor resonance theory of mind-reading. Brain Res Rev 54: 286–293, 2007 - PubMed
-
- Astafiev SV, Stanley CM, Shulman GL, Corbetta M. Extrastriate body area in human occipital cortex responds to the performance of motor actions. Nat Neurosci 7: 542–548, 2004 - PubMed
-
- Avikainen S, Forss N, Hari R. Modulated activation of the human SI and SII cortices during observation of hand actions. NeuroImage 15: 640–646, 2002 - PubMed
-
- Barsalou LW, Niedenthal PM, Barbey AK, Ruppert JA. Social embodiment. Psychol Learn Motiv 43: 43–92, 2003
Publication types
MeSH terms
Substances
Grants and funding
LinkOut - more resources
Full Text Sources