. 2010 Aug;104(2):829-39.
doi: 10.1152/jn.00166.2010. Epub 2010 Jun 10.

A beta oscillation network in the rat olfactory system during a 2-alternative choice odor discrimination task

Affiliations

A beta oscillation network in the rat olfactory system during a 2-alternative choice odor discrimination task

Leslie M Kay et al. J Neurophysiol. 2010 Aug.

Abstract

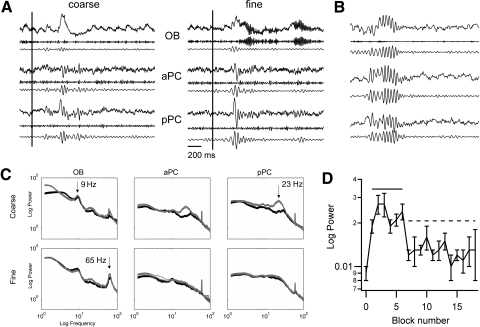
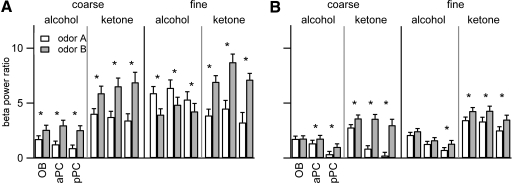
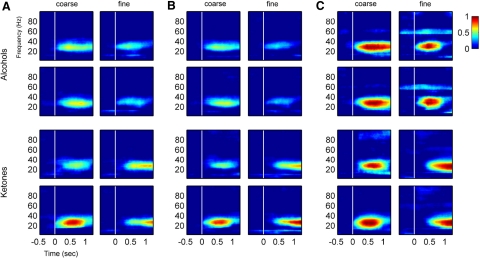
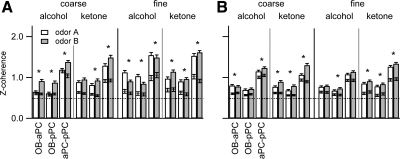
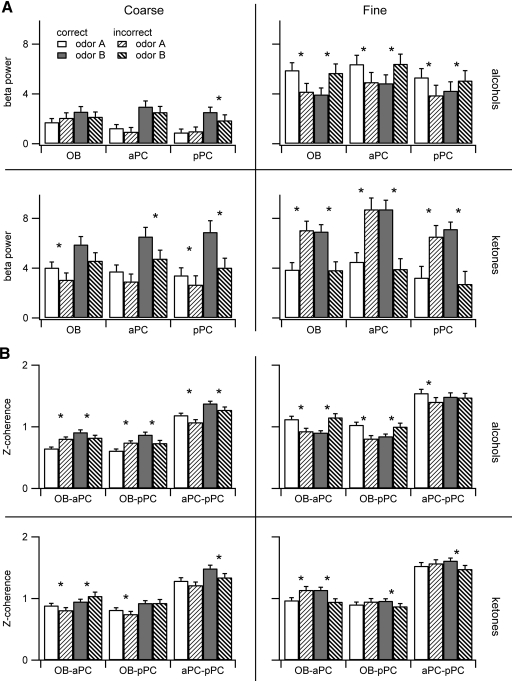
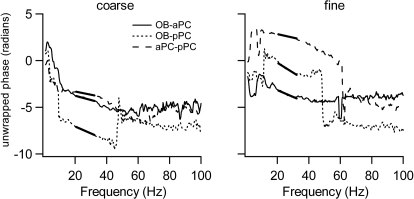
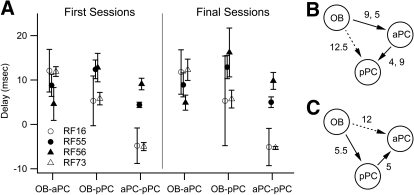
We previously showed that in a two-alternative choice (2AC) task, olfactory bulb (OB) gamma oscillations (approximately 70 Hz in rats) were enhanced during discrimination of structurally similar odorants (fine discrimination) versus discrimination of dissimilar odorants (coarse discrimination). In other studies (mostly employing go/no-go tasks) in multiple labs, beta oscillations (15-35 Hz) dominate the local field potential (LFP) signal in olfactory areas during odor sampling. Here we analyzed the beta frequency band power and pairwise coherence in the 2AC task. We show that in a task dominated by gamma in the OB, beta oscillations are also present in three interconnected olfactory areas (OB and anterior and posterior pyriform cortex). Only the beta band showed consistently elevated coherence during odor sniffing across all odor pairs, classes (alcohols and ketones), and discrimination types (fine and coarse), with stronger effects in first than in final criterion sessions (>70% correct). In the first sessions for fine discrimination odor pairs, beta power for incorrect trials was the same as that for correct trials for the other odor in the pair. This pattern was not repeated in coarse discrimination, in which beta power was elevated for correct relative to incorrect trials. This difference between fine and coarse odor discriminations may relate to different behavioral strategies for learning to differentiate similar versus dissimilar odors. Phase analysis showed that the OB led both pyriform areas in the beta frequency band during odor sniffing. We conclude that the beta band may be the means by which information is transmitted from the OB to higher order areas, even though task specifics modify dominance of one frequency band over another within the OB.


Figures

Fig. 1.
Fig. 1.
Beta oscillations are present in all 3 structures. A: sample data (2 s for each panel) from olfactory bulb (OB), anterior pyriform cortex (aPC), and posterior PC (pPC) during odor sampling for coarse/nonanone and fine/octanone odor sampling, vertical line indicates nosepoke which triggers the 1.5 s odor pulse. Top: raw local field potential (LFP); middle: gamma-filtered; bottom: beta-filtered. B: beta oscillations from a go/nogo (GNG) task for comparison, nosepoke is at the beginning of the 2 s sample (unpublished data from D. Frederick and L. M. Kay). Data for both A and B are normalized to the SD of the nonbeta periods surrounding the beta burst region. This allows visual comparison of the relative amplitudes of the beta event across rats and behavioral conditions. C: power spectra for all 3 areas during ketone discrimination (butanone/nonanone and octanone/heptanone). In each plot the black curve refers to odor A (butanone and octanone) and the gray curve to odor B (nonanone and heptanone). 95% confidence limits from the jackknife method are barely discernable about the spectral plots. Spectra are from data normalized by the SD of a preexperiment quiet period, so units are dimensionless. D: nonoverlapping blocks of 10 successive trials (both odors combined) show a fast rise in beta power at the beginning of each session. Data are from 1 session, fine ketone discrimination, but the rise is repeated across subjects and odor sets. The subsequent decrease in beta power in this example is not repeated in all rats and odor sets. The solid line signifies blocks that are elevated relative to the first block. The dashed line indicates blocks that are decreased relative to the blocks 3 and 4.
Fig. 2.
Fig. 2.
Elevation of beta power during odor sniffing is quantified by the beta power ratio [10*Log10(beta power during odor sniffing/beta power prior to odor sniffing) in decibels]. A: power ratio for each odorant averaged across rats and trials from the 1st sessions for each odor pair. Error bars show 95% confidence intervals; 0 indicates no change from the prestimulus period, and positive values indicate increases (no values were negative). B: power ratios from the final sessions. All values are significantly different from 0; *, significant differences in the power ratio between the 2 odorants in a discrimination pair (Kolmogorov-Smirnov test, see text for details). Only trials in which the rats responded correctly are included in this figure (see Fig. 5 for a comparison of correct and incorrect trials). See Table 1 for the identities of odors A and B for each discrimination pair.
Fig. 3.
Fig. 3.
Time-frequency coherence plots from the final sessions for each odor pair (data shown are from 1 rat, averages from ∼100 trials for each odorant). Zero on the time axis is the time of the nosepoke trigger of the odor (vertical white line); the odor takes 200–300 ms to reach the odor port. For each plot, 0 on the color scale indicates the upper 95% confidence value from the matched prestimulus z-coherence (Zcoh) for each frequency from the time period 1.5–0.5 s before the nosepoke. A: OB-aPC Zcoh; alcohols and ketones, fine and coarse discrimination are marked. B: OB-pPC Zcoh. C: aPC-pPC Zcoh. Note the difference in temporal patterns in Zcoh for different odorant pairs.
Fig. 4.
Fig. 4.
Beta band (15–35 Hz) coherence averaged across all rats for each pair of olfactory areas and each odor discrimination pair, correct trials only. A: 1st session averages across all rats and trials; B: last session averages. All mean values during odor sniffing are significantly above the mean for the prestimulus period (black horizontal line with error bars on each bar). The largest coherence values both before and during odor sniffing occur between the 2 pyriform areas (aPC-pPC). All prestimulus and odor sniffing coherence averages are significantly above the value from resampled data (dashed horizontal, upper 95% confidence level from mismatched trials' Zcoh). Asterisks indicate significant differences in Zcoh between the 2 odors in a pair (K-S test; see text for details on specific comparisons). See Table 1 for the identities of odors A and B for each discrimination pair.
Fig. 5.
Fig. 5.
Comparisons between correct and incorrect trials. Means from the first session for each odor discrimination pair are shown. A: beta power ratio for labeled odor discrimination pairs. Solid bars signify correct trials for each olfactory region, and hatched bars signify incorrect trials. Note that for significant differences in coarse discrimination incorrect trial means have lower power than correct trial means. For significant differences in fine discrimination incorrect trials produce power ratio means that are the same as the means from correct trials for the other odor in the discrimination pair. B: Zcoh correct vs. incorrect trial comparisons of means from the same sessions as in A. Differences appear smaller than for power but the same general patterns are observed. See Table 1 for the identities of odors A and B for each discrimination pair.
Fig. 6.
Fig. 6.
Examples of behavioral strategies in the 1st session for 2 odor pairs in one rat. Figures track performance statistics for each odor in the pair in 20 trial blocks, stepped by 1 trial. A: during coarse ketone discrimination the rat increased performance levels for both odors during the session (1st of 3 butanone-nonanone sessions). B: during fine ketone discrimination, the rat pressed the heptanone lever for most trials.
Fig. 7.
Fig. 7.
Unwrapped phase spectra from 1 rat for coarse (left) and fine (right) alcohols (octanol and hexanol, respectively). The dark line fit to the 20–32 Hz portion of the spectrum is used for delay estimates for the beta frequency band. Negative slope indicates that the 1st structure leads the second.
Fig. 8.
Fig. 8.
Summary of beta band delays between brain regions from the 4 rats. A: within rats, delays across odors and odor sets were very similar for each rat (see Table 3 for details). The values shown here are the averages and SDs of the delays computed across the 4 odor discrimination sessions (1st or final session for each odor pair) for each pair of brain regions. Note the low variance in delays between regions for 3 of the 4 rats. Positive values indicate that the 1st region in the pair leads the 2nd, and negative that the 2nd leads the 1st. B: delay circuit for rats RF55 and RF56. The 2 rats showed different delay times between OB-aPC and aPC-pPC (the 2 values from the 2 rats are indicated) but similar delay times for OB-pPC. The dashed arrow indicates the delay that is close to the sum of the other 2 delays. C: delay circuit for rats RF16 and RF73. The 2 rats showed similar delays for all 3 pairs of regions, and the sum of the delays from OB to pPC and pPC to aPC is approximately equal to the delay from OB to aPC (dashed arrow).

Similar articles

Cited by

References

    1. Beshel J, Kopell N, Kay LM. Olfactory bulb gamma oscillations are enhanced with task demands. J Neurosci 27: 8358–8365, 2007 - PMC - PubMed
    1. Best AR, Wilson DA. Coordinate synaptic mechanisms contributing to olfactory cortical adaptation. J Neurosci 24: 652–660, 2004 - PMC - PubMed
    1. Cohen Y, Reuveni I, Barkai E, Maroun M. Olfactory learning-induced long-lasting enhancement of descending and ascending synaptic transmission to the piriform cortex. J Neurosci 28: 6664–6669, 2008 - PMC - PubMed
    1. David FO, Hugues E, Cenier T, Fourcaud-Trocme N, Buonviso N. Specific entrainment of mitral cells during gamma oscillation in the rat olfactory bulb. PLoS Comput Biol 5: e1000551. - PMC - PubMed
    1. Deiber M-P, Missonnier P, Bertrand O, Gold G, Fazio-Costa L, Ibanez V, Giannakopoulos P. Distinction between perceptual and attentional processing in working memory tasks: a study of phase-locked and induced oscillatory brain dynamics. J Cognit Neurosci 19: 158–172, 2007 - PubMed

Publication types

LinkOut - more resources