. 2010 Sep 16;116(11):1980-9.
doi: 10.1182/blood-2009-11-252460. Epub 2010 Jun 10.

Effect of vascular endothelial growth factor and its receptor KDR on the transendothelial migration and local trafficking of human T cells in vitro and in vivo

Affiliations

Effect of vascular endothelial growth factor and its receptor KDR on the transendothelial migration and local trafficking of human T cells in vitro and in vivo

Monika Edelbauer et al. Blood. .

Abstract

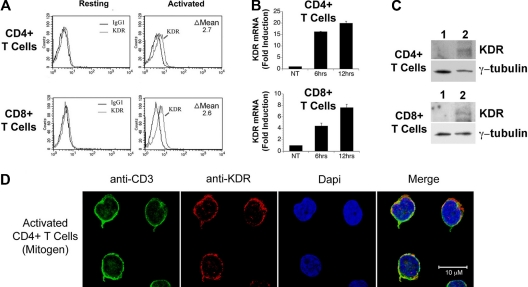
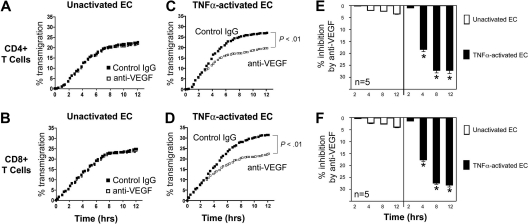
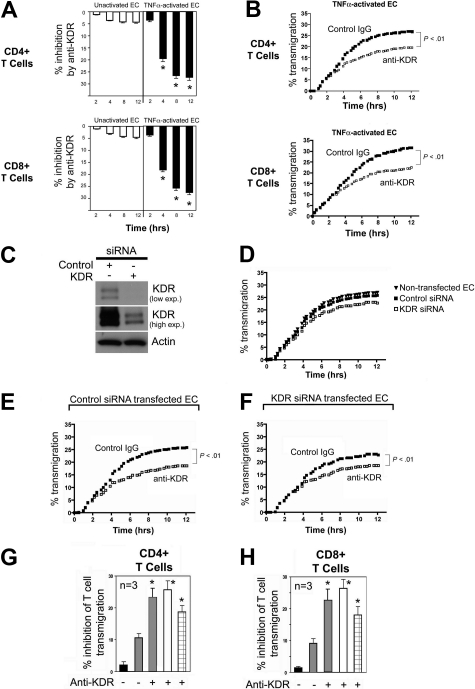
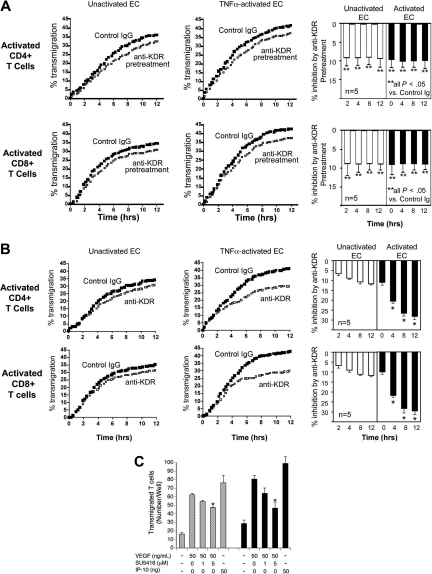
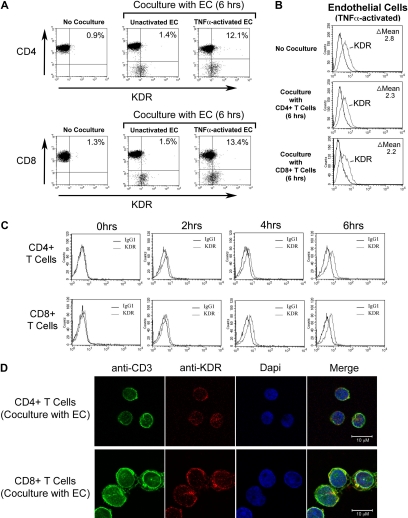
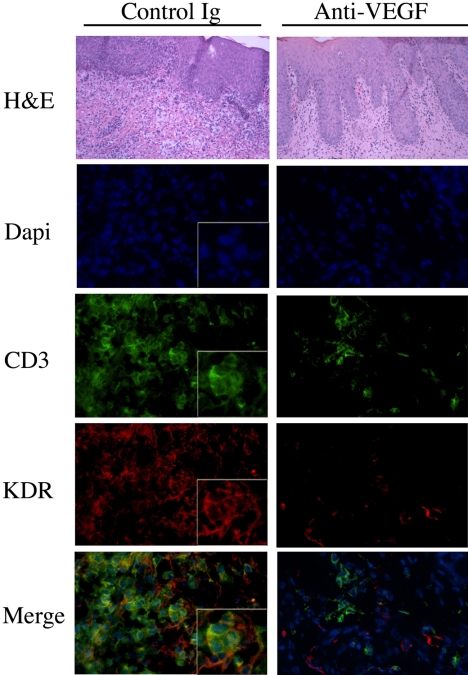
In these studies, we find that the vascular endothelial growth factor (VEGF) receptor KDR is expressed on subsets of mitogen-activated CD4(+) and CD8(+) T cells in vitro. We also found that KDR colocalizes with CD3 on mitogen-activated T cells in vitro and on infiltrates within rejecting human allografts in vivo. To evaluate whether VEGF and KDR mediate lymphocyte migration across endothelial cells (ECs), we used an in vitro live-time transmigration model and observed that both anti-VEGF and anti-KDR antibodies inhibit the transmigration of both CD4(+) and CD8(+) T cells across tumor necrosis factor α (TNFα)-activated, but not unactivated ECs. In addition, we found that interactions among CD4(+) or CD8(+) T cells and TNFα-activated ECs result in the induction of KDR on each T cell subset, and that KDR-expressing lymphocytes preferentially transmigrate across TNFα-activated ECs. Finally, using a humanized severe combined immunodeficient mouse model of lymphocyte trafficking, we found that KDR-expressing lymphocytes migrate into human skin in vivo, and that migration is reduced in mice treated with a blocking anti-VEGF antibody. These observations demonstrate that induced expression of KDR on subsets of T cells, and locally expressed VEGF, facilitate EC-dependent lymphocyte chemotaxis, and thus, the localization of T cells at sites of inflammation.


Figures

Figure 1
Figure 1
Expression of KDR on mitogen-activated CD4+ and CD8+ T cells. CD4+ and CD8+ T cells were purified from human blood by positive selection, and were stimulated with anti-CD3/anti-CD28 (as outlined in “Leukocyte isolation”) for 72 hours or as indicated. The expression of KDR was evaluated by FACS (A), by real-time PCR (B), by Western blot analysis (C), and by confocal microscopy (D). In panel A, the difference (delta, Δ) in mean fluorescence staining (experimental minus isotype control) is shown within each FACS plot. In panel B, the relative fold induction in KDR mRNA expression in 6- and 12-hour mitogen-activated CD4+ and CD8+ T cells versus untreated cells (NT) is shown. Panel C illustrates a representative Western blot of KDR in unactivated (lane 1) and 12-hour mitogen-activated T cells (lane 2). Panel D shows representative confocal microscopy images of 72-hour anti-CD3/anti-CD28-activated CD4+ T cells stained for CD3 and KDR. Approximaetly 20% of all activated T cells in our cultures express KDR (as illustrated) and the remainder of the T cells in the cultures have nondetectable or low levels of expression (not shown). All experiments are representative of n ≥ 5 per condition (A-B) and n = 3 (C).
Figure 2
Figure 2
Expression of KDR on T cells within human cardiac and renal allografts. (A) Representative photomicrographs illustrating the expression of KDR within human cardiac allografts. Top panels: immunohistochemical staining of KDR (rose brown color) in 3 human cardiac allografts with few (left top panel), moderate (middle top panel), and diffuse (right top panel) infiltrates. Middle and bottom panels: Immunofluorescence staining of CD3 and KDR in a representative cardiac allograft at ×400 magnification (middle) and 800× magnification (bottom). Merged images illustrate coexpression of CD3 and KDR (yellow color, arrows). (B) Confocal microscopy of a representative cardiac allograft with evidence of rejection illustrating coexpression of CD3 with KDR. (C) Scatter graphs showing the percentage of CD3+ stained T cells that coexpress KDR in cardiac and renal biopsies (black dots represent individual biopsies). The line shows the mean percent expression in all biopsies examined.
Figure 3
Figure 3
Effect of anti-VEGF on the transmigration of human CD4+ and CD8+ T cells across ECs. Endothelial cells (ECs) were cultured to confluency on FluoroBlok 3μM pore membranes in the upper chambers of transwells. Subsequently, CFSE-labeled T cells (5 × 10⁵ cells) were added into the upper chamber, and migration into the lower chamber was monitored real-time by the assessment of increasing fluorescence. The number of transmigrated cells in each lower chamber was determined using a standard curve, and the percentage of transmigrated cells at each time point was calculated. Transmigration assays were performed in the presence of control IgG (black dots) or anti–human VEGF (Genentech; 1μg/mL, open squares). (A-B) Representative experiment illustrating transmigration across unactivated ECs. No difference between anti-VEGF versus control IgG treatment is evident. (C-D) Representative experiment illustrating transmigration across 6-hour TNFα–activated ECs. (E-F) The mean percentage inhibition of transmigration by anti-VEGF across unactivated (□) or TNFα–activated ECs (■, n = 5 per experimental group). Anti-VEGF significantly inhibits transmigration across activated ECs at times > 2 hours. *P < .01 vs control IgG.
Figure 4
Figure 4
Effect of anti-KDR on the transendothelial migration of human CD4+ and CD8+ T cells. ECs were cultured to confluency on 3μM pore membranes in FluoroBlok transwells. CFSE-labeled CD4+ or CD8+ cells (5 × 10⁵ cells) were added into the upper chamber, and migration into the lower chamber was monitored in real time as described in “Lymphocyte migration assays.” Panel A illustrates the mean percent inhibition of transmigration of CD4+ or CD8+ cells (as indicated) by anti-KDR (R&D Systems) versus control IgG across unactivated (□) or TNFα–activated ECs (■, n = 5 experiments; *P < .01 vs contol IgG). Panel B illustrates a representative experiment showing patterns of inhibition of CD4+ or CD8+ T-cell transmigration by anti-KDR across TNFα-activated ECs (control IgG, solid dots; anti–human KDR, open squares). (C) Western blot analysis of control siRNA and KDR siRNA transfected ECs. Top and middle blots illustrate different exposure times of the same blot. (D) Representative experiments illustrating transmigration of CD4+ T cells across nontransfected, control siRNA-transfected ECs, and KDR siRNA-transfected endothelial cells. (E-F) Representative experiments illustrating the transmigration of CD4+ T cells across control siRNA-transfected ECs (E) or KDR siRNA-transfected ECs (F) in the absence (solid dots) or presence (open squares) of anti-KDR (2μg/mL). Panels G and H illustrate the mean percent inhibition (n = 3 experiments) of transmigration of CD4+ T cells (G) and CD8+ T cells (H) across control siRNA-transfected ECs compared with: nontransfected ECs (■) or KDR siRNA-transfected ECs (▩) in the absence or presence of anti-KDR as indicated. Also shown is the inhibitory effect of anti-KDR on T-cell transmigration across control siRNA-transfected ECs (□, as in panel E) or KDR siRNA-transfected ECs (⊞, as in panel F). *P < .01 vs contol IgG.
Figure 5
Figure 5
Effect of anti-KDR on the transendothelial migration of mitogen-activated human CD4+ and CD8+ T cells. ECs were cultured to confluency on FluoroBlok 3μM pore transwells. Subsequently, 72-hour mitogen-activated (anti-CD3/CD28) CD4+ or CD8+ T cells were CFSE labeled and added into the upper chamber of transwells, and migration into the lower chamber was monitored in real time. (A) Mitogen-activated T cells were pretreated with control IgG or anti-KDR for 3 hours and were washed in culture medium prior to the migration assay. Representative experiments showing transmigration patterns across untreated or TNFα–activated ECs are illustrated. The bar graphs represent mean percent inhibition of transmigration by anti-KDR pretreatment across unactivated ECs (□) or TNFα-activated ECs (■) in 5 experiments at each time point. **P < .05 comparing anti-KDR pretreated cells versus cells pretreated with control IgG. (B) Transmigration of mitogen-activated CD4+ or CD8+ T cells across unactivated ECs or TNFα-activated ECs in the presence of control IgG (solid dots) or anti-KDR (open squares) for the entire period of the assay. The bar graphs illustrate mean percent inhibition of transmigration by anti-KDR across unactivated ECs (□) or TNFα–activated ECs (■) in n = 5 experiments. *P < .01 comparing the effect of anti-KDR versus control IgG. (C) Unactivated (▨) or 72-hour mitogen-activated CD4+ T cells (■) were placed in the upper chamber of a microchemotaxis Boyden chamber, and migration into the lower chamber was assessed after 4 hours, as described in “Lymphocyte migration assays.” The chemotaxis response to VEGF or IP-10 (as a positive control) is illustrated. As indicated, the T cells were pretreated with SU5416, a pharmacologic KDR signaling inhibitor, prior to and during the chemotaxis assay. The illustrated experiment is representative of at least 3 performed in triplicate wells. P values were calculated using the Student t test (*P < .01).
Figure 6
Figure 6
Effect of ECs on inducible KDR expression by human CD4+ and CD8+ T cells. Untreated or TNFα-activated ECs (100U/mL for 6 hours) were incubated with purified populations of either CD4+ or CD8+ T cells (1 × 10⁵ cells) in a ratio of 1:1 for increasing times up to 6 hours, as indicated. After coculture, FACS was performed for the evaluation of T-cell expression of KDR. (A) Representative dot plots after culture of either CD4+ (top panels) or CD8+ T cells (bottom panels) with ECs. (B) Representative FACS histograms illustrating expression of KDR on TNFα–activated ECs before and after coculture with CD4+ or CD8+ T cells. (C) Representative FACS histograms illustrating the temporal induction of KDR expression on CD4+ T cells (top panels) or CD8+ T cells (bottom panels) after coculture with TNFα–activated ECs. (D) Confocal microscopy illustrating colocalization of CD3 and KDR on CD4+ T cells (top panels) and CD8+ T cells (bottom panels) after coculture with TNFα-activated endothelial cells. Panels A, B, and C are representative of n ≥ 5 per experimental group. Panel D is representative of n = 2, with identical results.
Figure 7
Figure 7
The effect of anti-VEGF on the recruitment of KDR-expressing lymphocytes in vivo. SCID mice with human skin transplants were humanized by adoptive transfer of human PBMCs intraperitoneally. At the time of humanization, and every other day, the mice received human IgG or humanized anti–human VEGF (5mg/kg in 100μl saline). After 14 days, the skin grafts were harvested and were analyzed by H&E staining and by immunofluorescence. Illustrated in the lefthand panels are representative photomicrografts of skin grafts harvested from mice treated with control IgG. The photomicrografts illustrated in the right panels are representative of skins harvested from mice treated with anti-VEGF. Expression of CD3 is illustrated in green, KDR in red, and the merged images (bottom panels, yellow color) illustrate coexpression of KDR with CD3 on T-cell infiltrates. Magnification of all micrographs, ×400. Boxed insets, magnification × 800. Representative of n = 4 mice in each group.

Similar articles

Cited by

References

    1. Leung DW, Cachianes G, Kuang WJ, Goeddel DV, Ferrara N. Vascular endothelial growth factor is a secreted angiogenic mitogen. Science. 1989;246(4935):1306–1309. - PubMed
    1. Senger DR, Galli SJ, Dvorak AM, Perruzzi CA, Harvey VS, Dvorak HF. Tumor cells secrete a vascular permeability factor that promotes accumulation of ascites fluid. Science. 1983;219(4587):983–985. - PubMed
    1. Reinders ME, Rabelink TJ, Briscoe DM. Angiogenesis and endothelial cell repair in renal disease and allograft rejection. J Am Soc Nephrol. 2006;17(4):932–942. - PubMed
    1. Ferrara N, Alitalo K. Clinical applications of angiogenic growth factors and their inhibitors. Nat Med. 1999;5(12):1359–1364. - PubMed
    1. Contreras AG, Briscoe DM. Every allograft needs a silver lining. J Clin Invest. 2007;117(12):3645–3648. - PMC - PubMed

Publication types

MeSH terms

Substances