. 2010 Sep;84(17):8433-45.
doi: 10.1128/JVI.00879-10. Epub 2010 Jun 10.

The PB2 subunit of the influenza virus RNA polymerase affects virulence by interacting with the mitochondrial antiviral signaling protein and inhibiting expression of beta interferon

Affiliations

The PB2 subunit of the influenza virus RNA polymerase affects virulence by interacting with the mitochondrial antiviral signaling protein and inhibiting expression of beta interferon

Katy M Graef et al. J Virol. 2010 Sep.

Abstract

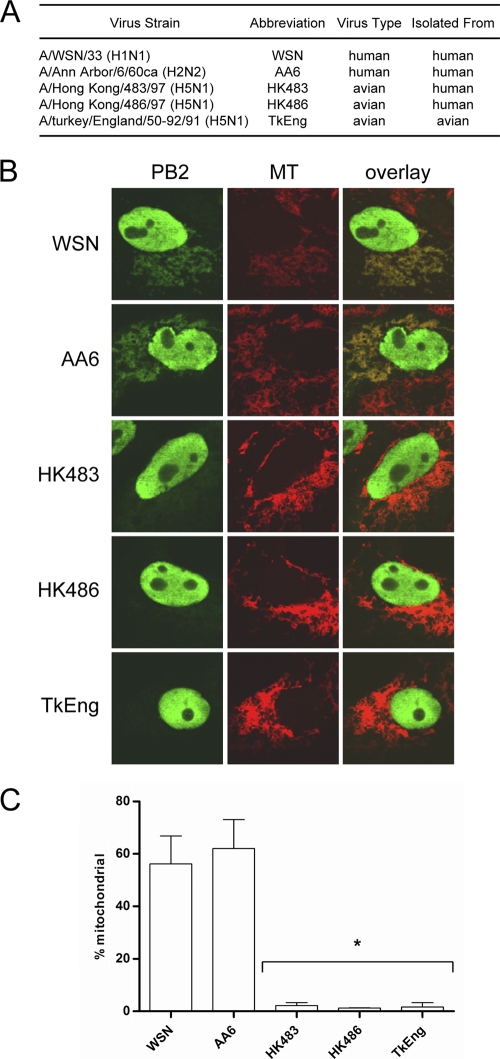
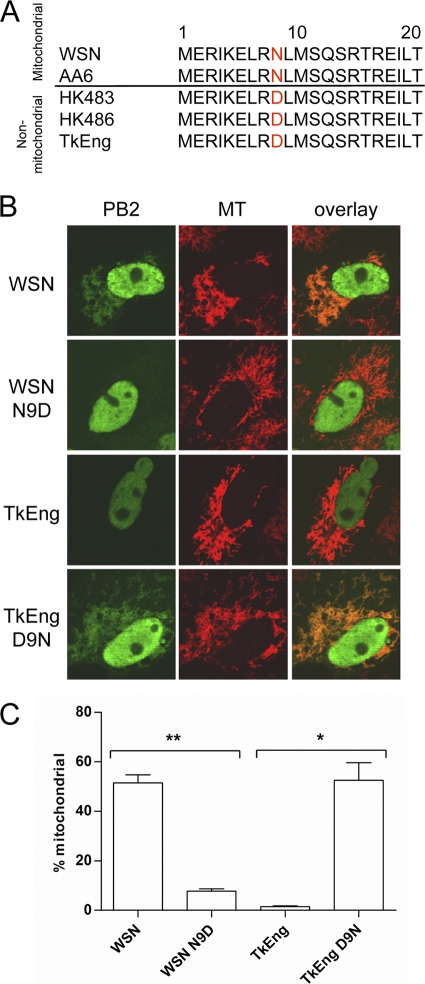
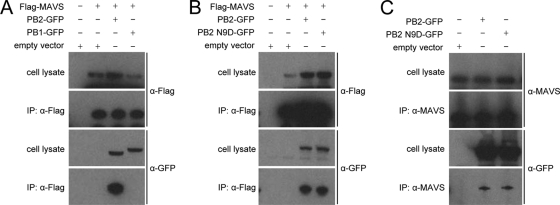
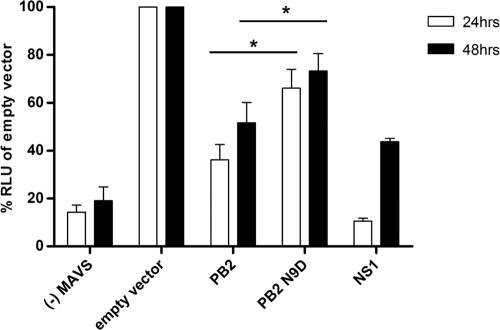
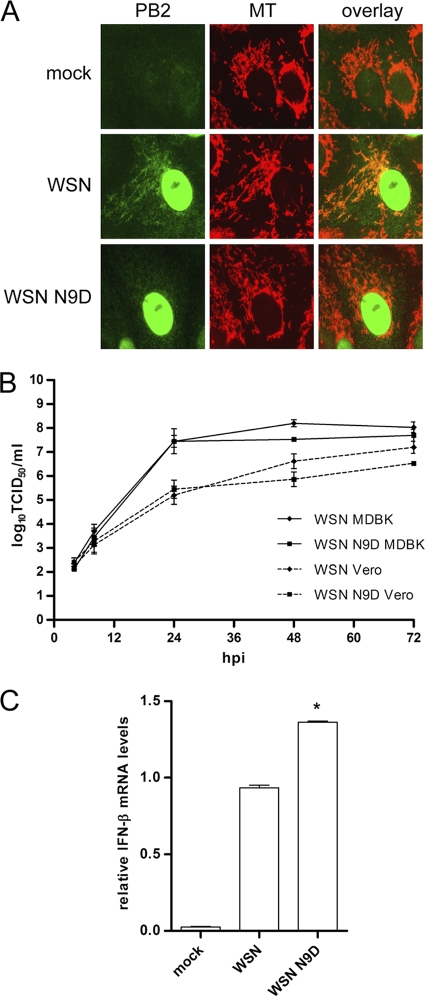
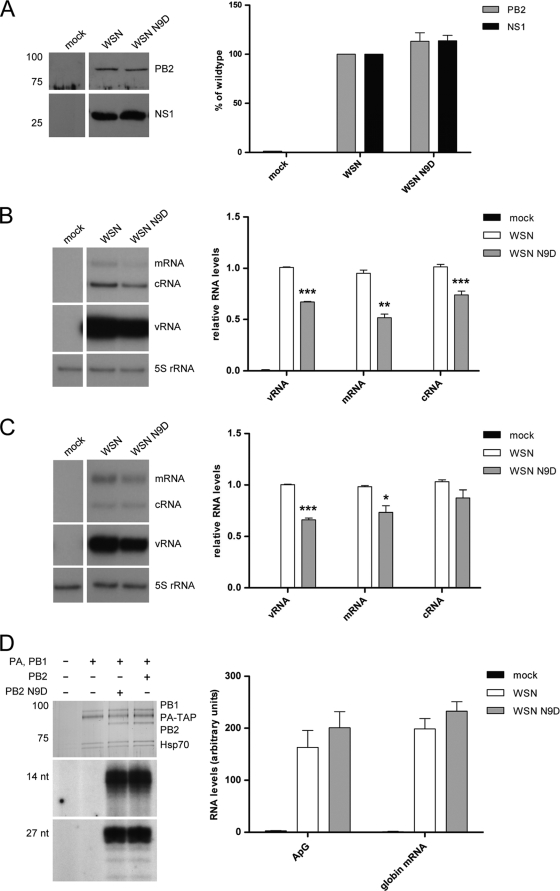
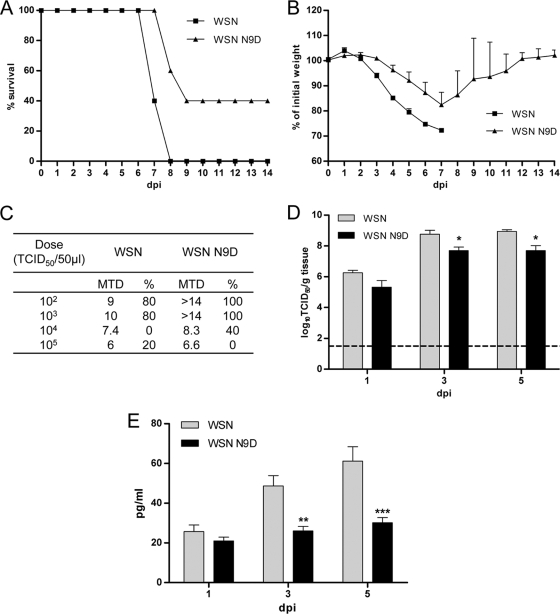
The PB2 subunit of the influenza virus RNA polymerase is a major virulence determinant of influenza viruses. However, the molecular mechanisms involved remain unknown. It was previously shown that the PB2 protein, in addition to its nuclear localization, also accumulates in the mitochondria. Here, we demonstrate that the PB2 protein interacts with the mitochondrial antiviral signaling protein, MAVS (also known as IPS-1, VISA, or Cardif), and inhibits MAVS-mediated beta interferon (IFN-beta) expression. In addition, we show that PB2 proteins of influenza viruses differ in their abilities to associate with the mitochondria. In particular, the PB2 proteins of seasonal human influenza viruses localize to the mitochondria while PB2 proteins of avian influenza viruses are nonmitochondrial. This difference in localization is caused by a single amino acid polymorphism in the PB2 mitochondrial targeting signal. In order to address the functional significance of the mitochondrial localization of the PB2 protein in vivo, we have generated two recombinant human influenza viruses encoding either mitochondrial or nonmitochondrial PB2 proteins. We found that the difference in the mitochondrial localization of the PB2 proteins does not affect the growth of these viruses in cell culture. However, the virus encoding the nonmitochondrial PB2 protein induces higher levels of IFN-beta and, in an animal model, is attenuated compared to the isogenic virus encoding a mitochondrial PB2. Overall this study implicates the PB2 protein in the regulation of host antiviral innate immune pathways and suggests an important role for the mitochondrial association of the PB2 protein in determining virulence.


Figures

FIG. 1.
FIG. 1.
PB2 proteins of different influenza virus subtypes display different localization patterns in Vero cells. (A) List of viruses used to examine PB2 localization (ca, cold adapted). (B) Images of cellular distribution of PB2 proteins in transfected Vero cells. Mitochondria (MT) were stained with MitoTracker Red. (C) PB2-expressing cells were scored for mitochondrial localization of PB2. Columns represent the percentage of PB2-expressing cells containing mitochondrial PB2 signal. Bars represent standard errors of the means based on three independent experiments (n = 61 to 107 cells/experiment). *, P < 0.0075, based on an unpaired, two-tailed Student's t test.
FIG. 2.
FIG. 2.
Polymorphism at position 9 is responsible for the differential localization of the PB2 protein. (A) Alignment of the mitochondrial localization signals of influenza A virus PB2 proteins. (B) Images of cellular distribution of wild-type and mutant PB2 proteins in transfected Vero cells. (C) PB2-expressing cells were scored for mitochondrial localization of PB2. Columns represent the percentage of PB2-expressing cells containing mitochondrial PB2 signal. Bars represent standard errors of the means based on three independent experiments (n = 63 to 110 cells/experiment). **, P < 0.0002; *, P < 0.021 (based on an unpaired, two-tailed Student's t test).
FIG. 3.
FIG. 3.
Alignment of PB2 amino acid sequences of influenza A viruses reveals host-specific conservation of position 9. PB2 protein sequences from the NCBI influenza virus database were grouped based on host and hemagglutinin subtype, followed by analysis of the amino acid at position 9. Human (excluding H5 isolates and swine-origin 2009 H1N1), n = 2686; human H5, n = 117; avian non-H5, n = 1215; avian H5, n = 788; other animal, n = 112; human swine-origin 2009 H1N1, n = 57; swine, n = 263.
FIG. 4.
FIG. 4.
Immunoprecipitation reveals interaction between Flag-MAVS and PB2-GFP. (A) Lysates from 293T cells transfected with Flag-MAVS and pcDNA-PB2-GFP or pcDNA-PB1-GFP and immunoprecipitates (IP) were analyzed by Western blotting using anti-Flag and anti-GFP antibodies. Immunoprecipitations of MAVS were performed with anti-Flag antibody. (B) Lysates from 293T cells transfected with Flag-MAVS and pcDNA-PB2-GFP or pcDNA-PB2 N9D-GFP and immunoprecipitates were analyzed by Western blotting using anti-Flag and anti-GFP antibodies. Immunoprecipitations of MAVS were performed with anti-Flag antibody. (C) Lysates from 293T cells transfected with pcDNA-PB2-GFP or pcDNA-PB2 N9D-GFP and immunoprecipitates were analyzed by Western blotting using anti-MAVS and anti-GFP antibodies. Immunoprecipitations of MAVS were performed with anti-MAVS antibody. α, anti.
FIG. 5.
FIG. 5.
PB2 inhibits MAVS-induced IFN-β production. 293T cells were transfected with a luciferase reporter plasmid under the control of an IFN-β promoter as well as a Renilla control plasmid, Flag-MAVS expression plasmid, and plasmids expressing either wild-type or N9D mutant PB2 or NS1 protein from A/WSN/33 or an empty vector. Twenty-four and 48 h later, cells were lysed, and both luciferase and Renilla activities were measured. Renilla-adjusted luciferase activity (RLU) in the presence of overexpressed Flag-MAVS but in the absence of viral proteins (empty vector) was set to 100%. Activity in the presence of viral proteins PB2, PB2 N9D, or NS1 was expressed as a percentage of that of the empty vector control. Only low levels of activity were detected in the absence (−) of Flag-MAVS. Bars represent standard errors of the means, based on between four and seven experiments. *, P < 0.01 based on a paired, two-tailed student's t test.
FIG. 6.
FIG. 6.
Wild-type and PB2 N9D mutant influenza viruses have similar growth kinetics in vitro but induce different levels of IFN-β mRNA. (A) Vero cells were infected with either WSN or WSN N9D virus at an MOI of 1. At 8 h postinfection, the cells were stained with MitoTracker Red (MT), and PB2 was visualized by indirect immunofluorescence. (B) MDBK or Vero cells were infected with either WSN or WSN N9D virus at an MOI of 0.001 and incubated at 37°C for 72 h. Aliquots of cell supernatants were collected at 4, 8, 24, 48, and 72 h postinfection (hpi), followed by analysis of TCID50 using MDCK cells. Data points represent an average of three independent infections. (C) A549 cells were infected with either WSN or WSN N9D virus at an MOI of 0.3. Twelve hours postinfection, total RNA was isolated, and RT-qPCR was performed to measure IFN-β mRNA levels. Infections were performed in triplicate twice using two independently rescued viruses of the same genetic background, and results for these two sets were subsequently averaged. Error bars represents standard errors of the means. *, P < 0.02, based on a paired, two-tailed Student's t test.
FIG. 7.
FIG. 7.
Accumulation of viral proteins and RNAs in A549 cells infected with wild-type or PB2 N9D mutant influenza virus and the effect of the N9D mutation on RNA polymerase activity. (A) Western blotting and quantitative analysis of PB2 and NS1 in lysates from A549 cells infected with WSN or WSN N9D at an MOI of 0.3 for 12 h. (B and C) Primer extension analysis of the three viral RNA species of the PB2 (B) and neuraminidase (C) genes in A549 cells infected with WSN or WSN N9D at an MOI of 0.3 for 12 h. Bars represent standard errors of the means based on four independent experiments. ***, P ≤ 0.0004; **, P < 0.005; *, P < 0.03 (based on a paired, two-tailed Student's t test). (D) 293T cells were transfected with plasmids expressing PA-TAP and PB1 and either wild-type PB2 or N9D PB2 from A/WSN/33. Cells were lysed at 48 h posttransfection, and proteins were purified by IgG-Sepharose column chromatography. Purified proteins were analyzed by SDS-PAGE and stained by silver (top panel). In vitro transcription assays were performed with ApG dinucleotide primer (middle panel) or in the presence of globin mRNA as a donor of capped-RNA primer (bottom panel). Transcription products were analyzed by PAGE and visualized by autoradiography. Quantitation of transcription products was done by phosphorimager analysis of experiments performed in triplicate.
FIG. 8.
FIG. 8.
WSN N9D virus expressing nonmitochondrial PB2 is attenuated in vivo. (A) Groups of five C57/B6 mice were infected intranasally with 104 TCID50s/50 μl of either WSN or WSN N9D virus. Animals were weighed daily and were euthanized when they lost more than 25% of their weight; percent survival is plotted on the y axis. (B) Weights of infected mice were measured daily and recorded as percentages of initial weight. Mean percent weights on each day are shown. (C) Groups of five C57/B6 mice were infected intranasally with the indicated dose of either WSN or WSN N9D virus. The table shows the mean time to death (MTD) in days and percent survival at each dose (%). (D and E) Groups of four C57/B6 mice were infected intranasally with 104 TCID50s of the WSN or WSN N9D virus, and the lungs were harvested at 1, 3, and 5 dpi. Viral titers (log10 TCID50/g of tissue) were determined on Vero 76 cells (D). The dashed line represents the limit of detection (101.5 TCID50s/g). Columns represent mean viral titers. Error bars represent standard errors of the means. *, P < 0.05, based on a Mann-Whitney test. (E) IFN-β was measured using a mouse IFN-β ELISA kit. Columns represent mean observed concentrations of cytokines from four mice. Error bars represent standard errors of the means. **, P < 0.01; ***, P < 0.001 (two-way analysis of variance with a Bonferroni posttest correction).

References

    1. Almond, J. W. 1977. A single gene determines the host range of influenza virus. Nature 270:617-618. - PubMed
    1. Carr, S. M., E. Carnero, A. Garcia-Sastre, G. G. Brownlee, and E. Fodor. 2006. Characterization of a mitochondrial-targeting signal in the PB2 protein of influenza viruses. Virology 344:492-508. - PubMed
    1. Chen, H., R. A. Bright, K. Subbarao, C. Smith, N. J. Cox, J. M. Katz, and Y. Matsuoka. 2007. Polygenic virulence factors involved in pathogenesis of 1997 Hong Kong H5N1 influenza viruses in mice. Virus Res. 128:159-163. - PubMed
    1. Chen, W., P. A. Calvo, D. Malide, J. Gibbs, U. Schubert, I. Bacik, S. Basta, R. O'Neill, J. Schickli, P. Palese, P. Henklein, J. R. Bennink, and J. W. Yewdell. 2001. A novel influenza A virus mitochondrial protein that induces cell death. Nat. Med. 7:1306-1312. - PubMed
    1. Claas, E. C., A. D. Osterhaus, R. van Beek, J. C. De Jong, G. F. Rimmelzwaan, D. A. Senne, S. Krauss, K. F. Shortridge, and R. G. Webster. 1998. Human influenza A H5N1 virus related to a highly pathogenic avian influenza virus. Lancet 351:472-477. - PubMed

Publication types

MeSH terms

LinkOut - more resources