

Spatial pattern of glaucomatous visual field loss obtained with regionally condensed stimulus arrangements
- PMID: 20538998
- PMCID: PMC3061505
- DOI: 10.1167/iovs.09-5067
Spatial pattern of glaucomatous visual field loss obtained with regionally condensed stimulus arrangements
Abstract
Purpose: To assess the spatial distribution of glaucomatous visual field defects (VFDs) obtained with regionally condensed stimulus arrangements.
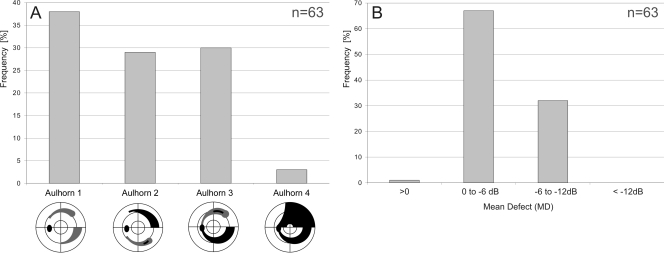
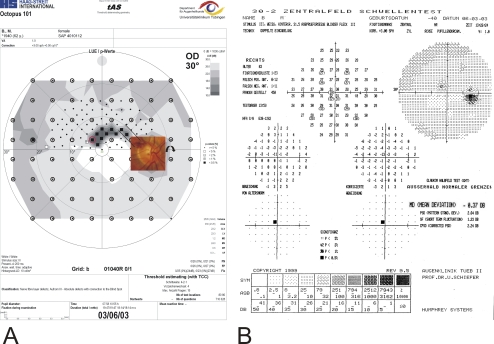
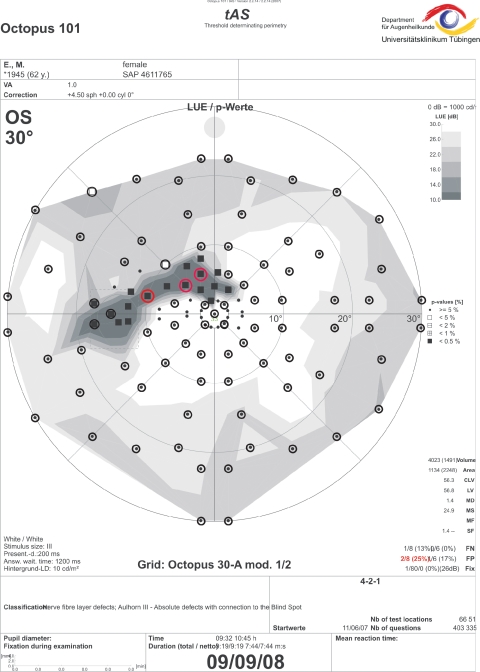
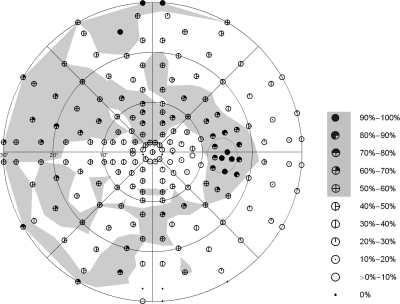
Methods: Sixty-three eyes of 63 glaucoma subjects were examined with threshold-estimating automated static perimetry (full threshold 4-2-1 dB strategy with at least three reversals) on an automatic campimeter or a full-field perimeter. Stimuli were added by the examiner to regionally enhance spatial resolution in regions that were suspicious for a glaucomatous VFD. These regions were characterized by contiguous local VFDs, attributable to the retinal nerve fiber bundle course according to the impression of the examiner. The added stimulus locations were subsets of a predefined, dense perimetric grid. All VFD locations with P < 0.05 (total deviation plots) were assessed by superimposing the visual field records of all participants.
Results: Glaucomatous VFD loss occurred more frequently in the upper than in the lower hemifield, with a typical retinal nerve fiber-related pattern and a preference of the nasal step region. More than 50% of the eyes with predominantly mild to moderate glaucomatous field loss showed defective locations in the immediate superior paracentral region within an eccentricity of 3°.
Conclusions: Conventional thresholding white-on-white perimetry with regionally enhanced spatial resolution reveals that glaucomatous visual field loss affects the immediate paracentral area, especially the upper hemifield, in many eyes with only mild to moderate glaucomatous visual field loss. Detailed knowledge about the spatial pattern and the local frequency distribution of glaucomatous VFDs is an essential prerequisite for creating regionally condensed stimulus arrangements for adequate detection and follow-up of functional glaucomatous damage.
Figures
Similar articles
-
Specification of progression in glaucomatous visual field loss, applying locally condensed stimulus arrangements.Graefes Arch Clin Exp Ophthalmol. 2009 Dec;247(12):1659-69. doi: 10.1007/s00417-009-1134-2. Epub 2009 Jul 29. Graefes Arch Clin Exp Ophthalmol. 2009. PMID: 19639334 Free PMC article.
-
Increased detection rate of glaucomatous visual field damage with locally condensed grids: a comparison between fundus-oriented perimetry and conventional visual field examination.Arch Ophthalmol. 2003 Apr;121(4):458-65. doi: 10.1001/archopht.121.4.458. Arch Ophthalmol. 2003. PMID: 12695242
-
Diffuse glaucomatous structural and functional damage in the hemifield without significant pattern loss.Arch Ophthalmol. 2009 Nov;127(11):1442-8. doi: 10.1001/archophthalmol.2009.196. Arch Ophthalmol. 2009. PMID: 19901209
-
Short wavelength automated perimetry, frequency doubling technology perimetry, and pattern electroretinography for prediction of progressive glaucomatous standard visual field defects.Ophthalmology. 2002 May;109(5):1009-17. doi: 10.1016/s0161-6420(02)01015-1. Ophthalmology. 2002. PMID: 11986111
-
The application of functional imaging in visual field defects: a brief review.Front Neurol. 2024 Feb 12;15:1333021. doi: 10.3389/fneur.2024.1333021. eCollection 2024. Front Neurol. 2024. PMID: 38410197 Free PMC article. Review.
Cited by
-
Retinal ganglion cell layer thickness and local visual field sensitivity in glaucoma.Arch Ophthalmol. 2011 Dec;129(12):1529-36. doi: 10.1001/archophthalmol.2011.352. Arch Ophthalmol. 2011. PMID: 22159673 Free PMC article.
-
New Normative Database of Inner Macular Layer Thickness Measured by Spectralis OCT Used as Reference Standard for Glaucoma Detection.Transl Vis Sci Technol. 2018 Feb 28;7(1):20. doi: 10.1167/tvst.7.1.20. eCollection 2018 Feb. Transl Vis Sci Technol. 2018. PMID: 29497582 Free PMC article.
-
Application of Pattern Recognition Analysis to Optimize Hemifield Asymmetry Patterns for Early Detection of Glaucoma.Transl Vis Sci Technol. 2018 Sep 4;7(5):3. doi: 10.1167/tvst.7.5.3. eCollection 2018. Transl Vis Sci Technol. 2018. PMID: 30197835 Free PMC article.
-
Early glaucoma involves both deep local, and shallow widespread, retinal nerve fiber damage of the macular region.Invest Ophthalmol Vis Sci. 2014 Feb 3;55(2):632-49. doi: 10.1167/iovs.13-13130. Invest Ophthalmol Vis Sci. 2014. PMID: 24370831 Free PMC article.
-
A Method Using Goldmann Stimulus Sizes I to V-Measured Sensitivities to Predict Lead Time Gained to Visual Field Defect Detection in Early Glaucoma.Transl Vis Sci Technol. 2018 Jun 7;7(3):17. doi: 10.1167/tvst.7.3.17. eCollection 2018 May. Transl Vis Sci Technol. 2018. PMID: 29892496 Free PMC article.
References
-
- Sihota R, Gupta V, Tuli D, et al. Classifying patterns of localized glaucomatous visual field defects on automated perimetry. J Glaucoma. 2007;16:146–152 - PubMed
-
- Lau LI, Liu CJ, Chou JC, Hsu WM, Liu JHK. Patterns of visual field defects in chronic angle-closure glaucoma with different disease severity. Ophthalmology. 2003;110:1890–1894 - PubMed
-
- Hoffmann EM, Boden C, Zangwill LM, et al. Inter-eye comparison of patterns of visual field loss in patients with glaucomatous optic neuropathy. Am J Ophthalmol. 2006;141:703–708 - PubMed
Publication types
MeSH terms
Grants and funding
LinkOut - more resources
Full Text Sources
Medical
Miscellaneous
