. 2011 Apr;44(4):491-9.
doi: 10.1165/rcmb.2009-0136OC. Epub 2010 Jun 10.

Ablation of glutaredoxin-1 attenuates lipopolysaccharide-induced lung inflammation and alveolar macrophage activation

Affiliations

Ablation of glutaredoxin-1 attenuates lipopolysaccharide-induced lung inflammation and alveolar macrophage activation

Scott W Aesif et al. Am J Respir Cell Mol Biol. 2011 Apr.

Abstract

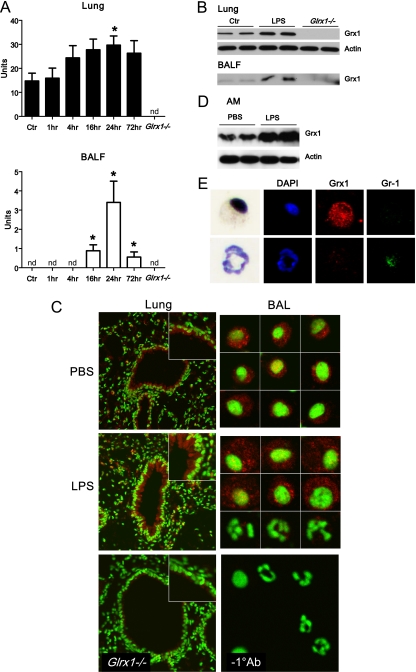
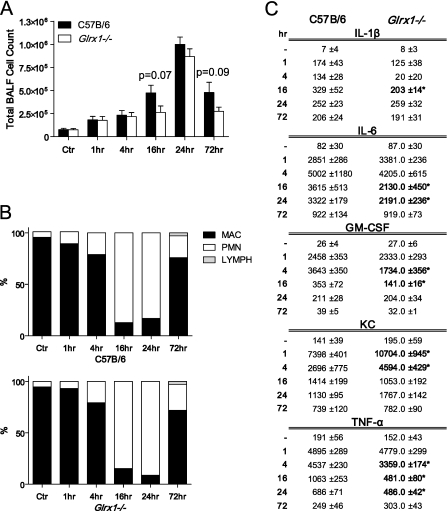
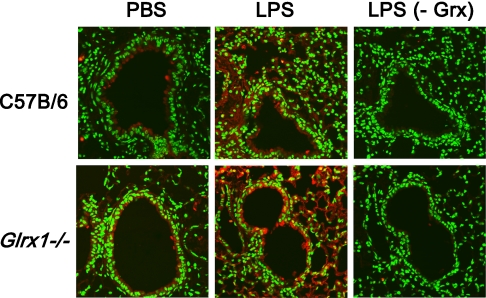
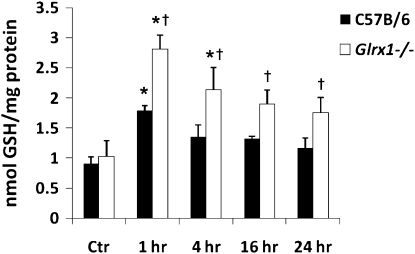
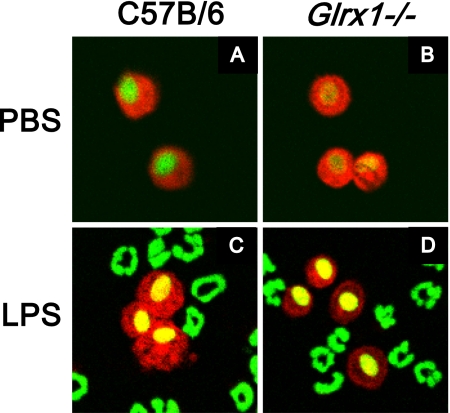
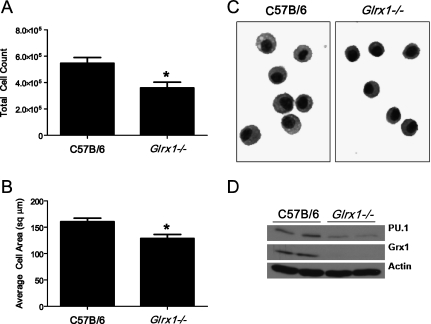
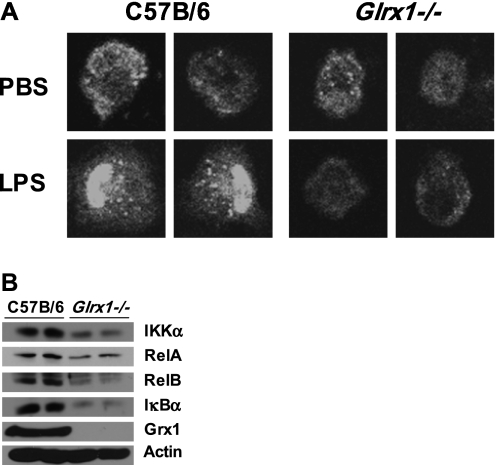
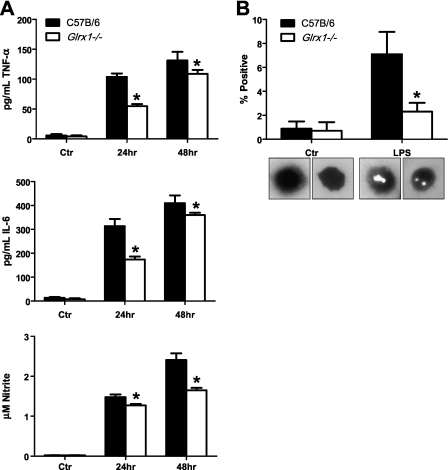
Protein S-glutathionylation (PSSG), a reversible posttranslational modification of reactive cysteines, recently emerged as a regulatory mechanism that affects diverse cell-signaling cascades. The extent of cellular PSSG is controlled by the oxidoreductase glutaredoxin-1 (Grx1), a cytosolic enzyme that specifically de-glutathionylates proteins. Here, we sought to evaluate the impact of the genetic ablation of Grx1 on PSSG and on LPS-induced lung inflammation. In response to LPS, Grx1 activity increased in lung tissue and bronchoalveolar lavage (BAL) fluid in WT (WT) mice compared with PBS control mice. Glrx1(-/-) mice consistently showed slight but statistically insignificant decreases in total numbers of inflammatory cells recovered by BAL. However, LPS-induced concentrations of IL-1β, TNF-α, IL-6, and Granulocyte/Monocyte Colony-Stimulating Factor (GM-CSF) in BAL were significantly decreased in Glrx1(-/-) mice compared with WT mice. An in situ assessment of PSSG reactivity and a biochemical evaluation of PSSG content demonstrated increases in the lung tissue of Glrx1(-/-) animals in response to LPS, compared with WT mice or PBS control mice. We also demonstrated that PSSG reactivity was prominent in alveolar macrophages (AMs). Comparative BAL analyses from WT and Glrx1(-/-) mice revealed fewer and smaller AMs in Glrx1(-/-) mice, which showed a significantly decreased expression of NF-κB family members, impaired nuclear translocation of RelA, and lower levels of NF-κB-dependent cytokines after exposure to LPS, compared with WT cells. Taken together, these results indicate that Grx1 regulates the production of inflammatory mediators through control of S-glutathionylation-sensitive signaling pathways such as NF-κB, and that Grx1 expression is critical to the activation of AMs.


Figures

Figure 1.
Figure 1.
Assessment of Grx1 activity and expression after oropharyngeal aspiration of LPS. (A) Whole-lung homogenates or cell-free BAL fluid (BALF) were collected from wild-type (WT) C57B/6 mice after PBS (Ctr) or LPS aspiration (5 μg). At the time points indicated, Grx1 activity was evaluated. As negative controls, lung homogenates and cell-free BALF from Glrx1−/− mice were included. Data are expressed as mean units of four mice per group (± SEM). *P < 0.05. nd, = not detected. (B) Protein was extracted from whole-lung homogenates or cell-free BALF of WT C57B/6 mice after PBS (Ctr) or LPS aspiration at 24 hours, and analyzed for Grx1 by immunoblot. As negative controls, lung homogenates and cell-free BALF from Glrx1−/− mice were included. Average mean (± SEM) densitometric values for Grx1 on two independent pooled experiments (n = 4 mice/group) include, for lung tissue, Ctr, 4.7 (1.5); LPS, 9.3 (0.0);* and Glrx1−/−, 0.0 (0.0); and for BALF, Ctr, 3.6 (0.4); LPS, 7.2 (2.0);* and Glrx1−/−, 0.0 (0.0). *P < 0.05 (ANOVA), compared with the PBS group. (C) In situ evaluation of Grx1 content in lung tissue (left) from WT mice exposed to PBS (Ctr) or LPS for 24 hours. As a control, Grx1 staining was performed, using a lung isolated from a Glrx1−/− mouse. Results were evaluated by confocal laser scanning microscopy. Original magnification, ×200. Insets: Twofold enlargement of bronchial epithelium. Grx1, red; DNA, green. Right: Assessment of Grx1 immunoreactivity in cells recovered from BALF. WT mice were exposed to PBS or LPS, and were lavaged 24 hours later. Cytospins were prepared for the evaluation of Grx1 content via confocal laser scanning microscopy. Individual cells are shown. Right middle: Top two rows of cells represent cells with morphology consistent with alveolar macrophages (Ams), whereas bottom row represents cells with morphology consistent with neutrophils. Images are representative of more than 50 cells evaluated per group. Mean relative fluorescence intensity (RFI) values (SEM; n = 25) for Grx1 content in macrophages include 0.9 (0.1) for PBS, and 1.4 (0.3)* for LPS. Right bottom: As a control, the primary antibody was omitted from the staining protocol. Original magnification, ×400. Grx1, red; DNA, green. *P < 0.05 (ANOVA), compared with PBS group. (D) Assessment of Grx1 content in AMs isolated from BALF 24 hours after instillation of LPS or PBS. Macrophages were isolated via Percoll gradient centrifugation, and Grx1 content was assessed via Western blot analysis. (E) Evaluation of Grx1 and Gr-1 expression in BAL cells. Twenty-four hours after instillation with LPS, BAL was performed, and cells were stained with anti-Grx1 and Gr-1 antibodies. Expression of Grx1 (red) and Gr-1 (green) was examined via confocal laser scanning microscopy. Nuclei were counterstained with 4′,6-diamidino-2-phenylindole (DAPI) (blue). After confocal analysis, coverslips were removed and cells were stained using a Hema3 kit. Note the strong immunoreactivity of Grx1 in AMs, which do not react with Gr-1 antibody, whereas neutrophils that react with anti-Gr-1 show low levels of Grx1.
Figure 2.
Figure 2.
Comparative assessment of pulmonary inflammation in C57B/6 WT and Glrx1−/− mice after oropharyngeal aspiration of LPS. (A) BALF was collected from WT C57B/6 or Glrx1−/− mice at time points indicated. Cells were enumerated using an automated cytometer. Data are expressed as mean (± SEM) total cell counts (n = 4–8 mice/group/time point). Actual P values for differences between Glrx1−/− and WT mice at 16-hour and 24-hour time points are indicated. (B) Cellular differentials in BAL reflect percentages of macrophages (MAC), lymphocytes (LYMPH), and neutrophils (PMN). No statistically significant differences were apparent between WT and Glrx1−/− groups. (C) Evaluation of cytokines in cell-free BALF via ELISA. Data are expressed as mean pg/ml (± SEM) (n = 4–8 mice/group/time point). *P < 0.05, compared with WT mice (ANOVA).
Figure 3.
Figure 3.
In situ analysis of protein S-glutathionylation in WT C57B/6 and Glrx1−/− mice, 4 hours after oropharyngeal aspiration of LPS. Paraffin-embedded lung sections were stained for S-glutathionylated proteins (red) by Grx1-catalyzed derivatization, and nuclei were counterstained with Sytox Green. Images were captured by laser scanning confocal microscopy, using identical instrument settings. Images are representative results of four animals/group. Right: As a negative control, Grx1 was omitted (−Grx) from the staining reaction conducted on a serial lung section. Original magnification, ×200. PSSG, red; DNA, green.
Figure 4.
Figure 4.
Biochemical analysis of protein S-glutathionylation in homogenized lung tissues of C57B/6 and Glrx1−/− mice exposed to LPS. Mice were exposed to LPS oropharyngeally, and at the indicated times, homogenized lung tissue was prepared, proteins were precipitated, and glutathione was released using Na–borohydride and quantified using the glutathione disulfide (GSSG) reductase recycling assay, with 5 ,5′ -dithio-bis-(2-nitrobenzoic acid) (DTNB) as substrate. Na–borohydride–dependent formation of 5′-thio-2-nitrobenzoic acid was calculated and normalized to protein content. Data are expressed as nmol tripeptide glutathione (GSH)/mg protein. *P < 0.05 (ANOVA), compared with respective control (Ctr) groups. P < 0.05 (ANOVA), compared with respective C57B/6 groups exposed to LPS.
Figure 5.
Figure 5.
Assessment of S-glutathionylation (PSSG) in BAL cells. C57B/6 WT mice and Glrx1−/− mice were exposed to PBS, or LPS via oropharyngeal aspiration, for 16 hours. Mice were lavaged, and 5 × 10⁴ BAL cells were centrifuged onto glass microscope slides before being stained for S-glutathionylated proteins (red), using Grx1-catalyzed cysteine derivatization. Nuclei were counterstained with Sytox Green (green), and images were captured using laser scanning confocal microscopy. Images are representative results of four animals/group. Original magnification, ×200. Mean (SEM, n = 25) RFI values for PSSG content in AMs include, for C57Bl\6 mice, PBS, 1.4 (0.1); for Glrx1−/− mice, PBS, 1.4 (0.1); for C57Bl\6 mice, LPS, 1.5 (0.1); for Glrx1−/− mice, LPS, 1.2 (0.1). No statistically significant differences were apparent between different treatment groups.
Figure 6.
Figure 6.
Evaluation of AMs from WT or Glrx1−/− mice. (A) Control C57B/6 WT or Glrx1−/− mice were lavaged, and total cells recovered were enumerated. Data represent mean values (± SEM) of total cells recovered from 15 mice/group. *P < 0.05 (ANOVA). (B) Recovered BAL cells were centrifuged onto glass microscope slides and stained, and their two-dimensional areas were calculated using digital image analysis software. Data represent mean area (± SEM) of 300 cells from three mice/group. *P < 0.05 (ANOVA). (C) Representative micrograph of cells highlights morphologic differences between AMs derived from WT C57B/6 and Glrx1−/− mice. Original magnification, ×200. (D) Immunoblot analysis of AMs for the E-twenty-six transcription factor and marker of macrophage maturity PU.1, Grx1, and actin as genotype and loading controls, respectively. BAL cells were derived from control mice and consisted of > 99% AMs. Data are representative of blots obtained from three independent experiments. Average mean (± SEM) densitometric values for PU.1 (n = 4, two pooled experiments) include, for C57B/6 mice, 3.0 (1.6); for Glrx1−/− mice, 1.0 (0.3).* Average mean (± SD) densitometric values for Grx1 (n = 4, two pooled experiments) include, for C57B/6 mice, 2.9 (0.1); for Glrx1−/− mice, 0.0 (0.4). *P < 0.05 (ANOVA), compared with C57Bl\6 group.
Figure 7.
Figure 7.
Analysis of LPS-induced RelA nuclear translocation and expression of NF-κB pathway components in AM derived from C57B/6 mice and Glrx1−/− mice. (A) Nuclear translocation of RelA (p65) (white) after LPS stimulation of AMs from WT C57B/6 mice and Glrx1−/− mice. Images were captured by laser scanning confocal microscopy, and are representative of three independent experiments. Original magnification, ×400. (B) Expression of NF-κB pathway components assessed by immunoblot of whole-cell lysates of AMs obtained via BAL from untreated WT C57B/6 or Glrx1−/− mice. Data are representative of blots obtained from three independent experiments. Average mean (± SEM) densitometric values (n = 4, two pooled experiments) include for IKKα, C57B/6 mice, 8.5 (1.2); Glrx1−/− mice, 5.0 (0.0)*; for RelA, C57B/6 mice, 4.7 (0.3); Glrx1−/− mice, 3.1 (1.9);* RelB, for C57B/6 mice, 5.5 (1.1); Glrx1−/− mice, 2.5 (2.1);* IκBα, for C57B/6 mice, 9.1 (1.9); Glrx1−/− mice, 4.2 (0.2);* and Grx1, for C57B/6 mice, 13.1 (0.7); Glrx1−/− mice, 0.0 (0.0).* *P < 0.05 (ANOVA), compared with C57Bl/6 group.
Figure 8.
Figure 8.
Assessment of activation of WT or Glrx1−/− AMs after stimulation with LPS in culture. (A) AMs were isolated from control C57Bl/6 and Glrx1−/− mice. Cells were plated and stimulated with LPS for assessment of secretion of IL-6 and TNF-α by ELISA. Bottom: Evaluation of nitrite content via Griess assay as an indicator of nitric oxide synthase 2 (NOS2) activation. Data represent mean (± SEM) values, and are representative of three independent experiments *P < 0.05 (ANOVA). (B) Phagocytosis was analyzed by latex bead incorporation. Cells containing two or more beads were considered positive. Data are expressed as percent positive (± SEM) after scoring 300 cells/animal. Original magnification, ×200. *P < 0.05 (ANOVA).

References

    1. Reynaert NL, Ckless K, Wouters EF, van der Vliet A, Janssen-Heininger YM. Nitric oxide and redox signaling in allergic airway inflammation. Antioxid Redox Signal 2005;7:129–143. - PubMed
    1. Rahman I, Biswas SK, Jimenez LA, Torres M, Forman HJ. Glutathione, stress responses, and redox signaling in lung inflammation. Antioxid Redox Signal 2005;7:42–59. - PubMed
    1. Andreadis AA, Hazen SL, Comhair SA, Erzurum SC. Oxidative and nitrosative events in asthma. Free Radic Biol Med 2003;35:213–225. - PubMed
    1. Cantin AM, North SL, Hubbard RC, Crystal RG. Normal alveolar epithelial lining fluid contains high levels of glutathione. J Appl Physiol 1987;63:152–157. - PubMed
    1. Janssen-Heininger YM, Mossman BT, Heintz NH, Forman HJ, Kalyanaraman B, Finkel T, Stamler JS, Rhee SG, van der Vliet A. Redox-based regulation of signal transduction: principles, pitfalls, and promises. Free Radic Biol Med 2008;45:1–17. - PMC - PubMed

Publication types

MeSH terms