

Normal cerebral, renal and abdominal regional oxygen saturations using near-infrared spectroscopy in preterm infants
- PMID: 20539273
- PMCID: PMC3013378
- DOI: 10.1038/jp.2010.71
Normal cerebral, renal and abdominal regional oxygen saturations using near-infrared spectroscopy in preterm infants
Abstract
Objective: The aim of this study is to characterize baseline regional oxygen saturations (rSO(2)) in stable preterm infants during the first weeks of life.
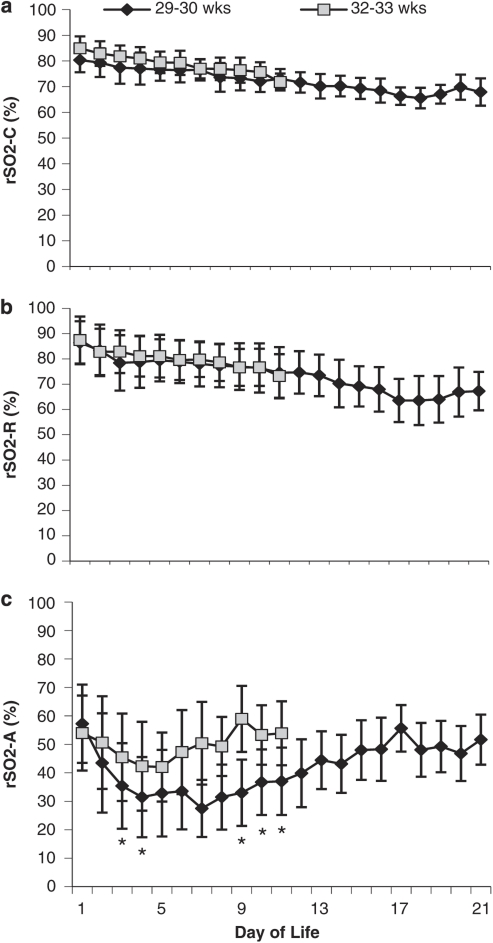
Study design: Cerebral, renal and abdominal rSO(2) were continuously monitored from the time of birth to 21 days in twelve preterm infants of 29-34 weeks gestation. Regional saturations were evaluated for trends over time, variability and differences between gestational ages (GAs) and reported pediatric values.
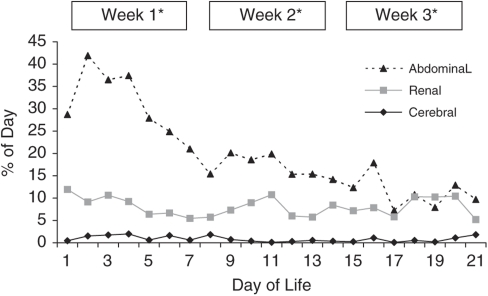
Result: Both cerebral (66-83%) and renal (64-87%) rSO(2) baselines were within the range of reported neonatal values but consistently decreased over the first weeks of life (P<0.01). The baseline abdominal rSO(2) was 32-66% and increased with GA (P=0.05). The rSO(2) variability was lowest for cerebral measurements and highest at the abdomen. Abdominal rSO(2) variability decreased over time (P≤0.05).
Conclusion: Daily baseline rSO(2) in preterm infants changes over the first weeks of life, especially at the abdomen. Evolution in baseline rSO2 over time may indicate regional developmental maturation of physiological oxygen balance.
Figures
Similar articles
-
Regional tissue oxygenation in association with duration of hypoxaemia and haemodynamic variability in preterm neonates.Arch Dis Child Fetal Neonatal Ed. 2010 May;95(3):F213-9. doi: 10.1136/adc.2009.161604. Epub 2009 Nov 29. Arch Dis Child Fetal Neonatal Ed. 2010. PMID: 19948524
-
Renal Oxygenation (rSO 2 ) Population Parameter Estimates in Premature Infants Routinely Monitored With Near-Infrared Spectroscopy.Adv Neonatal Care. 2022 Aug 1;22(4):370-377. doi: 10.1097/ANC.0000000000000927. Epub 2021 Aug 18. Adv Neonatal Care. 2022. PMID: 34417355
-
Splanchnic-Cerebral Oxygenation Ratio Decreases during Enteral Feedings in Anemic Preterm Infants: Observations under Near-Infrared Spectroscopy.Neonatology. 2018;113(1):75-80. doi: 10.1159/000481396. Epub 2017 Nov 8. Neonatology. 2018. PMID: 29131125 Free PMC article.
-
New technology for noninvasive brain monitoring: continuous cerebral oximetry.Minerva Anestesiol. 2006 Jul-Aug;72(7-8):605-25. Minerva Anestesiol. 2006. PMID: 16865080 Review. English, Italian.
-
Global perfusion assessment and tissue oxygen saturation in preterm infants: where are we?Early Hum Dev. 2013 Jun;89 Suppl 1:S44-6. doi: 10.1016/S0378-3782(13)70014-8. Early Hum Dev. 2013. PMID: 23809350 Review.
Cited by
-
Maturation of Intestinal Oxygenation: A Review of Mechanisms and Clinical Implications for Preterm Neonates.Front Pediatr. 2020 Jul 3;8:354. doi: 10.3389/fped.2020.00354. eCollection 2020. Front Pediatr. 2020. PMID: 32719756 Free PMC article. Review.
-
Correlation of abdominal rSO2 with superior mesenteric artery velocities in preterm infants.J Perinatol. 2013 Aug;33(8):609-12. doi: 10.1038/jp.2013.3. Epub 2013 Feb 7. J Perinatol. 2013. PMID: 23392317 Free PMC article.
-
Abdominal Near Infrared Spectroscopy can be reliably used to measure splanchnic oxygenation changes in preterm infants.J Perinatol. 2023 Jun;43(6):716-721. doi: 10.1038/s41372-022-01576-2. Epub 2022 Dec 10. J Perinatol. 2023. PMID: 36496514 Free PMC article.
-
The effect of drip versus intermittent feeding on splanchnic oxygenation in preterm infants with intrauterine growth restriction: a prospective randomized trial.Eur J Pediatr. 2023 Mar;182(3):1317-1328. doi: 10.1007/s00431-023-04810-x. Epub 2023 Jan 13. Eur J Pediatr. 2023. PMID: 36637540 Clinical Trial.
-
Brain and renal oxygenation measured by NIRS related to patent ductus arteriosus in preterm infants: a prospective observational study.BMC Pediatr. 2021 Dec 9;21(1):559. doi: 10.1186/s12887-021-03036-w. BMC Pediatr. 2021. PMID: 34886825 Free PMC article.
References
-
- Noori S, Seri I.Etiology, pathophysiology, and phases of neonatal shockIn: Kleinman CS, Seri I, Polin RA (eds).Hemodynamics and Cardiology: Neonatology Questions and Controversies Saunders: Philadelphia; 20083–18.
-
- Petrova A, Mehta R. Near-infrared spectroscopy in the detection of regional tissue oxygenation during hypoxic events in preterm infants undergoing critical care. Pediatr Crit Care Med. 2006;7:449–454. - PubMed
-
- Lemmers PMA, Toet M, van Schelven LJ, van Bel F. Cerebral oxygenation and cerebral oxygen extraction in the preterm infant: the impact of respiratory distress syndrome. Exp Brain Res. 2006;173:458–467. - PubMed
-
- Li J, Van Arsdell GS, Zhang G, Cai S, Humpl T, Caldarone CA, et al. Assessment of the relationship between cerebral and splanchnic oxygen saturations measured by near-infrared spectroscopy and direct measurements of systemic haemodynamic variables and oxygen transport after the Norwood procedure. Heart. 2006;92:1678–1685. - PMC - PubMed
-
- Toet MC, Lemmers PMA. Brain monitoring in neonates. Early Hum Dev. 2009;85:77–84. - PubMed
MeSH terms
Substances
Grants and funding
LinkOut - more resources
Full Text Sources
Other Literature Sources
Medical
