. 2010 Jul 26;50(7):1205-22.
doi: 10.1021/ci100010v.

When is chemical similarity significant? The statistical distribution of chemical similarity scores and its extreme values

Affiliations

When is chemical similarity significant? The statistical distribution of chemical similarity scores and its extreme values

Pierre Baldi et al. J Chem Inf Model. .

Abstract

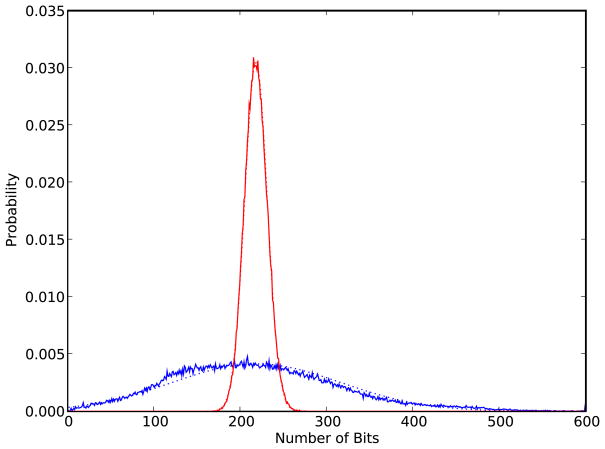
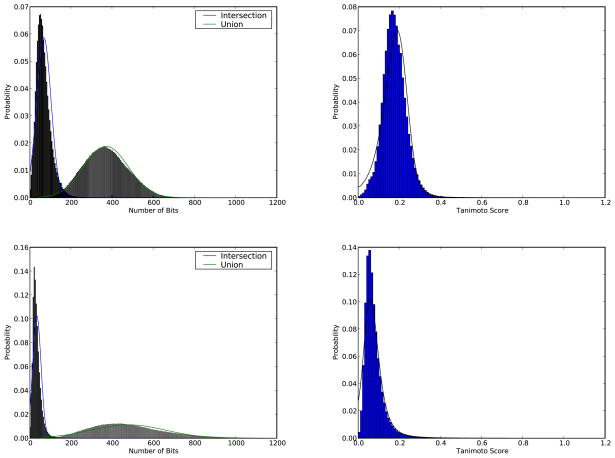
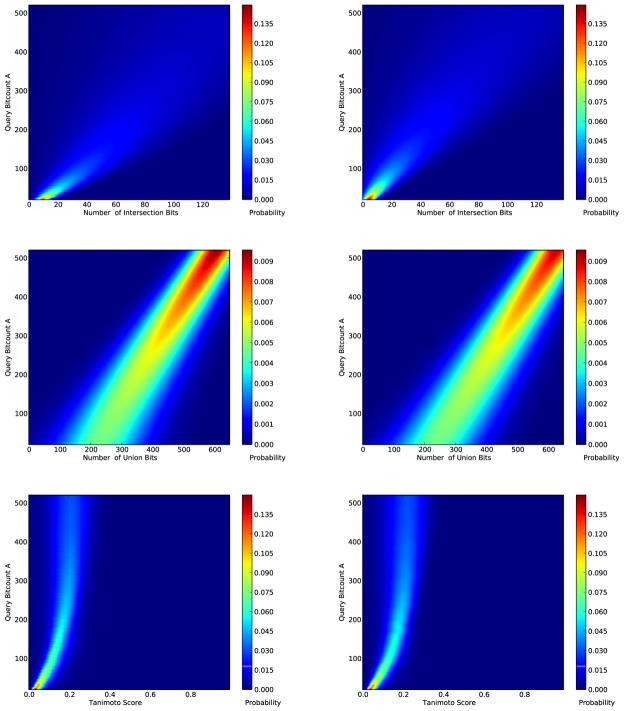
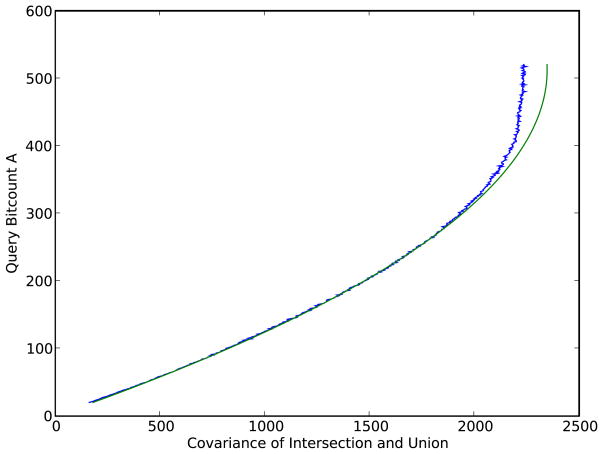
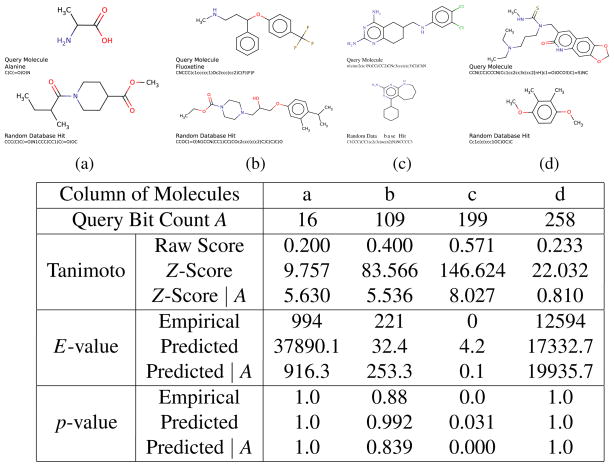
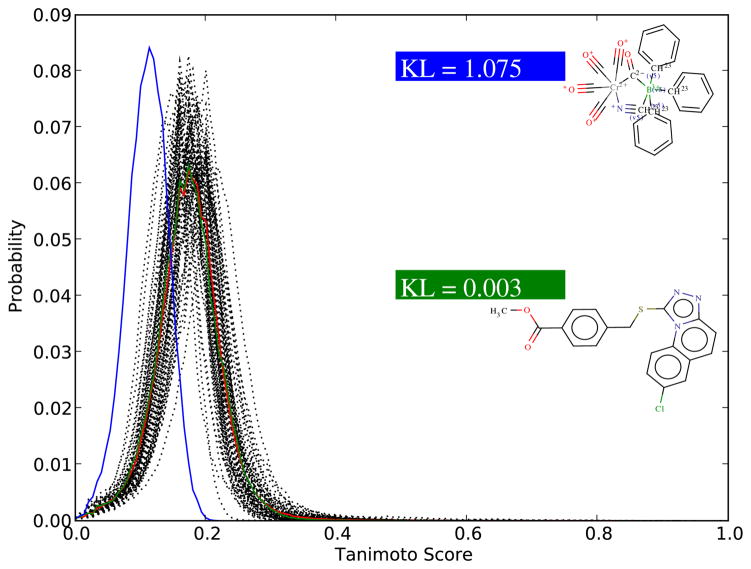
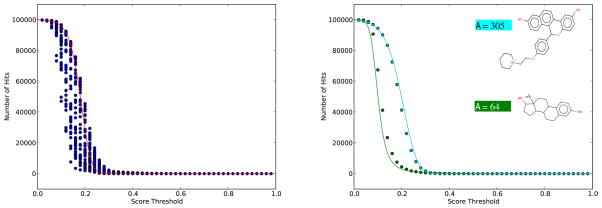
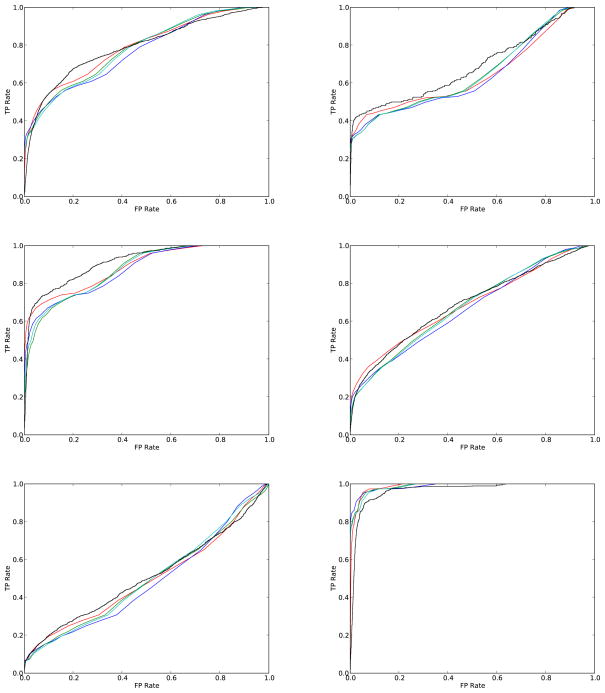
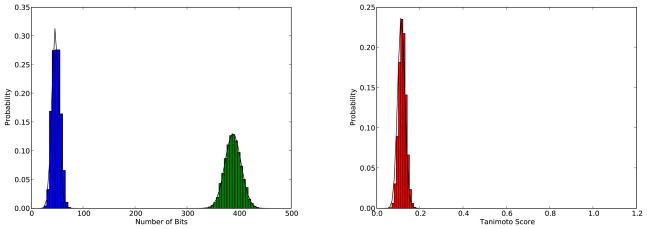
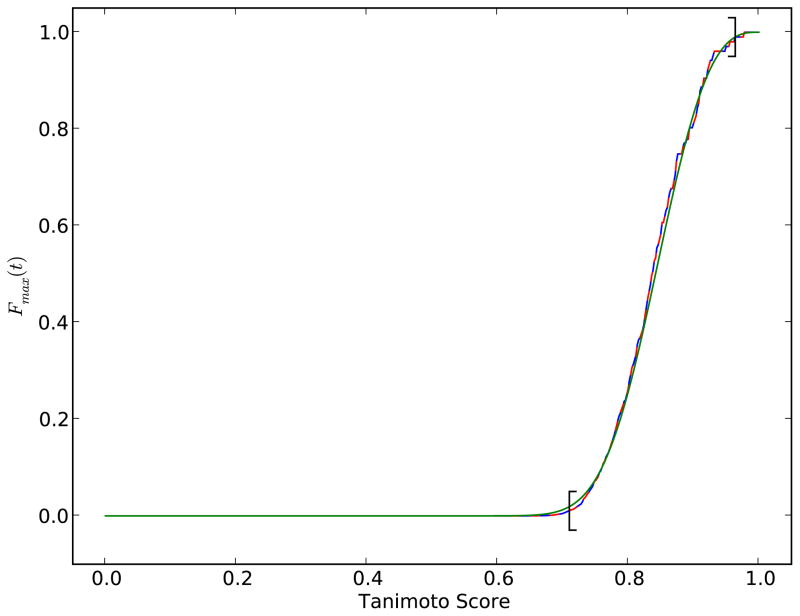
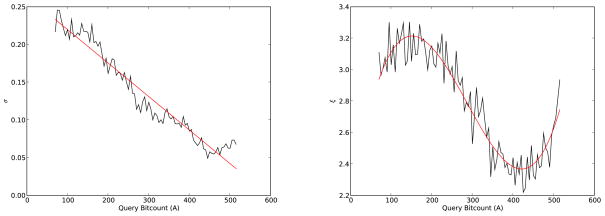
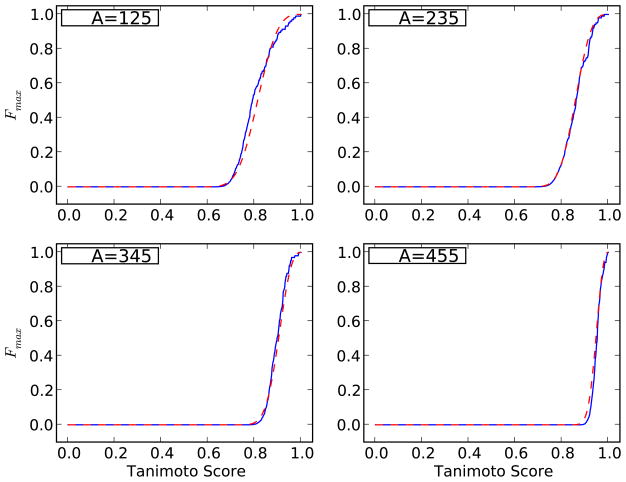
As repositories of chemical molecules continue to expand and become more open, it becomes increasingly important to develop tools to search them efficiently and assess the statistical significance of chemical similarity scores. Here, we develop a general framework for understanding, modeling, predicting, and approximating the distribution of chemical similarity scores and its extreme values in large databases. The framework can be applied to different chemical representations and similarity measures but is demonstrated here using the most common binary fingerprints with the Tanimoto similarity measure. After introducing several probabilistic models of fingerprints, including the Conditional Gaussian Uniform model, we show that the distribution of Tanimoto scores can be approximated by the distribution of the ratio of two correlated Normal random variables associated with the corresponding unions and intersections. This remains true also when the distribution of similarity scores is conditioned on the size of the query molecules to derive more fine-grained results and improve chemical retrieval. The corresponding extreme value distributions for the maximum scores are approximated by Weibull distributions. From these various distributions and their analytical forms, Z-scores, E-values, and p-values are derived to assess the significance of similarity scores. In addition, the framework also allows one to predict the value of standard chemical retrieval metrics, such as sensitivity and specificity at fixed thresholds, or receiver operating characteristic (ROC) curves at multiple thresholds, and to detect outliers in the form of atypical molecules. Numerous and diverse experiments that have been performed, in part with large sets of molecules from the ChemDB, show remarkable agreement between theory and empirical results.


Figures

Figure 1
Figure 1
Distributions of the number of 1-bits in fingerprints from the ChemDB (blue solid line) and fingerprints from the matching Single-Parameter Bernoulli model (red solid line) with p ≈ 205/1,024). Both distributions are constructed using a random sample of 100,000 fingerprints. Though both distributions have similar means, the standard deviations differ significantly. The distributions are also fit using two Normal distributions, which approximate the data well (dotted lines).
Figure 2
Figure 2
Results obtained with 100 molecules randomly selected from ChemDB used as queries against a sample of 100,000 molecules randomly selected from ChemDB. The two upper figures correspond to fingerprints of length 1,024 with modulo OR lossy compression, while the two lower figures correspond to fingerprints with lossless compression (equivalent to uncompressed fingerprints). The figures in the left column display the histograms of the sizes of the intersections and unions and their direct Normal approximations in blue and green respectively. The figures in the right column display the histograms of the Tanimoto scores (blue bars), while the solid black line shows the corresponding approximation derived using the ratio of correlated Normal random variables approach.
Figure 3
Figure 3
Empirical (left) and predicted (right) heat maps corresponding to the distribution of the intersections (top), unions (middle), and Tanimoto scores (bottom). The distribution is conditioned on the size of the query molecule, A, shown on the vertical axis. The empirical results are obtained by using for each A 100 molecules randomly selected from the molecules in ChemDB with size A. The theoretical results of the intersection and union distributions use the Conditional Normal Uniform model. At each value of A, the mean and variance of the intersection and union are obtained from Equations 29, 30, 33, and 36 respectively. The theoretical score distribution is a result of the ratio of correlated Normal random variables approximation given by Equations 2–6
Figure 4
Figure 4
The empirical and theoretical covariance Cov(I,U) between the intersection and the union, conditioned on the size A of the query molecule, shown in blue and green respectively. Empirical results are obtained by using, for each A, 100 molecules randomly selected from the molecules in ChemDB with size A. A is shown on the vertical axis for consistency with the previous heat map figures. Theoretical predictions are derived with the Conditional Normal Uniform Model conditioned on A (Equation 39).
Figure 5
Figure 5
The first row shows four query molecules. The second row considers four corresponding potential “hits” in the corresponding columns. The table shows the size A of the four query molecules followed by the corresponding Tanimoto scores, Z-scores, E-scores, and p-values observed empirically or predicted from the theory with and without conditioning on the size A of the query molecule. Molecules are represented by Daylight-style fingerprints of length 1024 with OR lossy compression.
Figure 6
Figure 6
Empirical score distributions for 100 query molecules satisfying A = 220. Each black curve is associated with one of the molecules and is obtained by scoring the molecule against a random sample of 100,000 molecules from the ChemDB. The red curve corresponds to the mean of the 100 curves and is essentially identical to the predicted distribution of scores conditioned on A = 220. The green curve corresponds to a molecule in the group that is typical and the blue curve to a molecule that is atypical. The difference between the distributions is measured here in terms of Kullback-Leibler (KL) divergence or relative entropy.
Figure 7
Figure 7
Left: 55 Estrogen Receptor ligands are used to query a sample of 100,000 molecules randomly selected from the ChemDB. Horizontal axis represents Tanimoto threshold scores. Vertical axis represents number of scores above the threshold (hits). Each dot represents a query’s number of hits above the corresponding threshold on the horizontal axis. Superimposed dots are indistinguishable (see text). The solid red line represents the predicted E-values based on the ratio of two correlated Normal random variables approximation integrated over all values of A in the sample. Right: Dots associated with the Estrogen Receptor ligand with the largest A (cyan) and the smallest A (green) are isolated. The solid lines show predicted E-values based on the ratio of two correlated Normal random variables conditioned on the size of the two query molecules: A = 305 (cyan) and A = 64 (green).
Figure 8
Figure 8
ROC curves for six data sets of active molecules (from left to right and top to bottom): (1) 55 Estrogen receptor ligands; (2) 17 Neuraminidase inhibitors; (3) 24 p38 MAP Kinase inhibitors; (4) 40 Gelatinase A and general MMP ligands; (5) 36 Androgen receptor ligands; and (6) 28 steroids with Corticosteroid Binding Globulin (CBG) receptor affinity. Empirical ROC curves are in black. Various approximations of the negative molecule scores distribution are used to get the theoretical curves, including a ratio of two correlated Normal random variables distribution (red), a single Normal distribution (blue), a single Gamma distribution (green), and a single Beta distribution (cyan), using a random sample of 100,000 molecules from the ChemDB.
Figure 9
Figure 9
Results obtained using 100 query fingerprints to search 100,000 fingerprints. All finger-prints have length N = 1,024 and are generated using a Single-Parameter Bernoulli model with p = 205/1,024 to fit the average values in the actual ChemDB fingerprints. Left: histograms for the size of the intersections (blue) and the unions (green), together with their Normal approximations (solid black lines). Right: histogram for the corresponding Tanimoto scores (red), together with the corresponding ratio of correlated Normal random variables approximation (solid black line).
Figure 10
Figure 10
Plot of Fmax(t), the cumulative distribution of the maximum score, computed on a random sample of 100,000 molecules from the ChemDB in three different ways. The solid blue curve represents the approach of Equation 50. The dashed red line represents that Poisson approach of Equation 53. The green solid line shows the Weibull distribution approach of Equation 54. The left and right brackets on the curve indicate the acceptable boundary within which t1 and t2 ought to be selected (Equations 56 and 57).
Figure 11
Figure 11
Polynomial fitting of the parameters σ (left) and ξ (right) of the Weibull distribution (Equation 54) using a first and third degree polynomial respectively (in red) as a function of the size A of the query. The empirical values (black) are obtained using a random sample of D=100,000 molecules from the ChemDB. The range of A used for fitting is [70,520]. The polynomials are σ = −0.00044423A + 0.26429116 and ξ = 0.00000009A3 − 0.00007387A2 + 0.01643368A +2.12103400.
Figure 12
Figure 12
Cumulative extreme value distribution Fmax(t) computed on a random sample of D = 100,000 molecules from the ChemDB, conditioned on different values of A, using 100 query molecules at each value of A. The solid blue curve represents the values obtained using Equation 50 applied with the empirical distribution F(t) of the scores. The dashed red line shows the corresponding Weibull distribution obtained using the polynomial fit for the parameters σ and ξ as a function of A (solid red line in Figure 11).

References

    1. Chen J, Swamidass SJ, Dou Y, Bruand J, Baldi P. ChemDB: a public database of small molecules and related chemoinformatics resources. Bioinformatics. 2005;21:4133–4139. - PubMed
    1. Irwin JJ, Shoichet BK. ZINC–A Free Database of Commercially Available Compounds for Virtual Screening. J Chem Inf Comput Sci. 2005;45:177–182. - PMC - PubMed
    1. Chen J, Linstead E, Swamidass SJ, Wang D, Baldi P. ChemDB Update–Full Text Search and Virtual Chemical Space. Bioinformatics. 2007;23:2348–2351. - PubMed
    1. Wheeler D, Barrett T, Benson D, Bryant S, Canese K, Chetvernin V, Church D, DiCuccio M, Edgar R, Federhen S, et al. Database resources of the national center for biotechnology information. Nucleic Acids Res. 2006;35:D5–D12. - PMC - PubMed
    1. Wang Y, Xiao J, Suzek T, Zhang J, Wang J, Bryant S. PubChem: a public information system for analyzing bioactivities of small molecules. Nucleic Acids Res. 2009;37:W623–W633. - PMC - PubMed