Comparative Study
. 2010 Jun 12:9:29.
doi: 10.1186/1476-072X-9-29.

Do measures matter? Comparing surface-density-derived and census-tract-derived measures of racial residential segregation

Affiliations
Comparative Study

Do measures matter? Comparing surface-density-derived and census-tract-derived measures of racial residential segregation

Michael R Kramer et al. Int J Health Geogr. .

Abstract

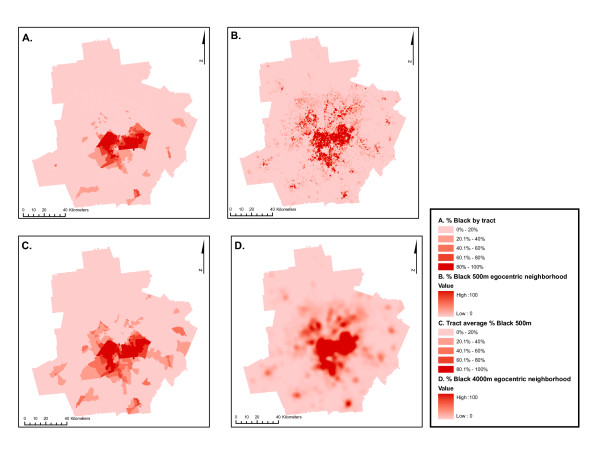
Background: Racial residential segregation is hypothesized to affect population health by systematically patterning health-relevant exposures and opportunities according to individuals' race or income. Growing interest into the association between residential segregation and health disparities demands more rigorous appraisal of commonly used measures of segregation. Most current studies rely on census tracts as approximations of the local residential environment when calculating segregation indices of either neighborhoods or metropolitan areas. Because census tracts are arbitrary in size and shape, reliance on this geographic scale limits understanding of place-health associations. More flexible, explicitly spatial derivations of traditional segregation indices have been proposed but have not been compared with tract-derived measures in the context of health disparities studies common to social epidemiology, health demography, or medical geography. We compared segregation measured with tract-derived as well as GIS surface-density-derived indices. Measures were compared by region and population size, and segregation measures were linked to birth record to estimate the difference in association between segregation and very preterm birth. Separate analyses focus on metropolitan segregation and on neighborhood segregation.

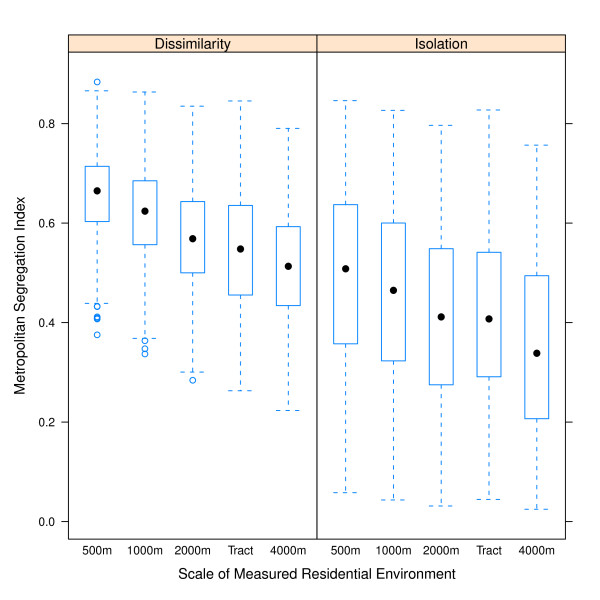
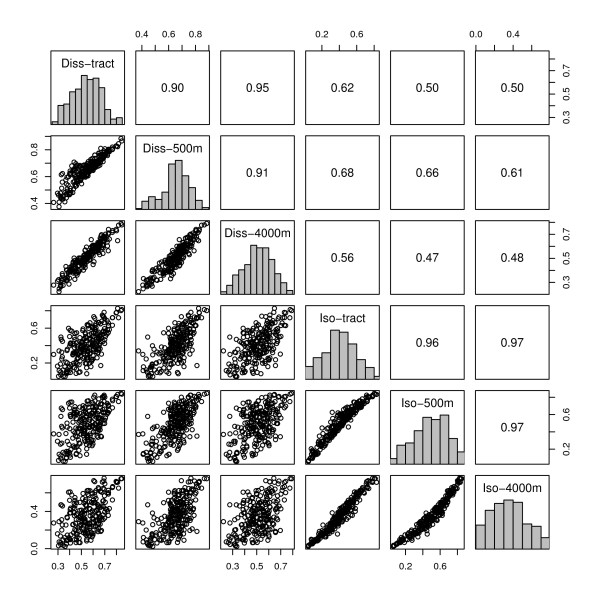
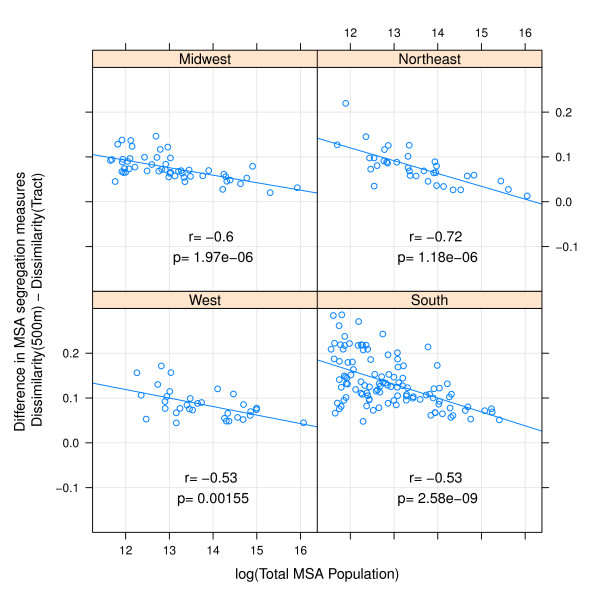
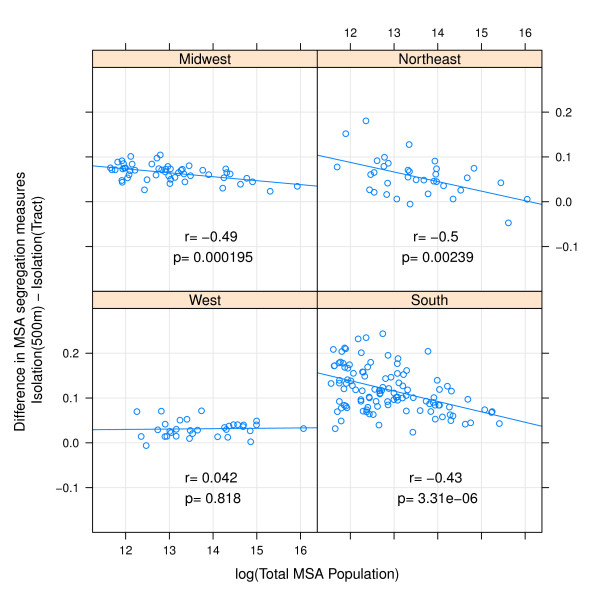
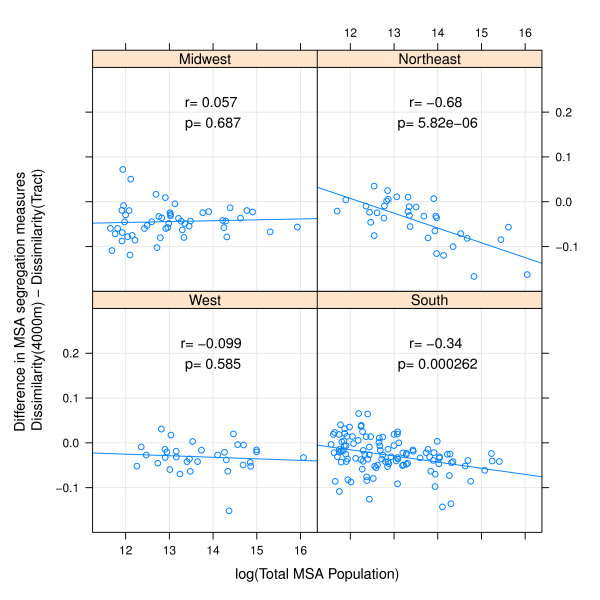
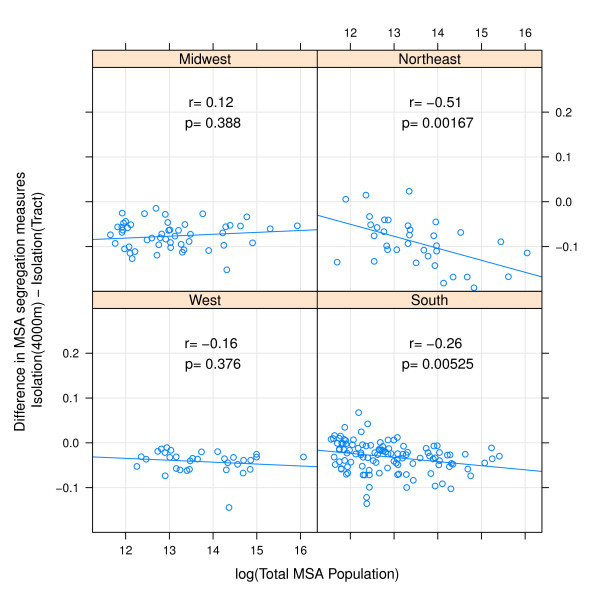
Results: Across 231 metropolitan areas, tract-derived and surface-density-derived segregation measures are highly correlated. However overall correlation obscures important differences by region and metropolitan size. In general the discrepancy between measure types is greatest for small metropolitan areas, declining with increasing population size. Discrepancies in measures are greatest in the South, and smallest in Western metropolitan areas. Choice of segregation index changed the magnitude of the measured association between segregation and very preterm birth. For example among black women, the risk ratio for very preterm birth in metropolitan areas changed from 2.12 to 1.68 for the effect of high versus low segregation when using surface-density-derived versus tract-derived segregation indices. Variation in effect size was smaller but still present in analyses of neighborhood racial composition and very preterm birth in Atlanta neighborhoods.

Conclusion: Census tract-derived measures of segregation are highly correlated with recently introduced spatial segregation measures, but the residual differences among measures are not uniform for all areas. Use of surface-density-derived measures provides researchers with tools to further explore the spatial relationships between segregation and health disparities.


Figures

Figure 1
Figure 1
Distribution of MSA residential segregation measured with five definitions of neighborhood environment. Median value indicated by filled black dot, 25th and 75th percentile indicated by the lower and upper ends of the box, whiskers are 1.5 times the inter-quartile range, and outliers are hollow dots beyond whiskers.
Figure 2
Figure 2
Correlation of MSA black-white segregation indices. Histograms (on the diagonal) and correlations (plots below diagonal, Spearman rank correlation coefficients above the diagonal) of segregation indices for 231 US MSA's, 2000. P-values for all pair wise correlations are < 0.0001. (Diss-tract: census tract-derived dissimilarity index; Diss-500 m, Diss-4000 m: surface-density-derived dissimilarity index for MSA's with neighborhoods defined with a 500 m or 4000 m kernel density function; Iso-tract: census tract-derived isolation index; Iso-500 m, Iso-4000 m: surface-density-derived isolation index for MSA's with neighborhoods defined with a 500 m or 4000 m kernel density function)
Figure 3
Figure 3
Difference in MSA dissimilarity index when measured using 500 m-egocentric neighborhood versus census tract by region. The arithmetic difference of MSA segregation calculated with 500-meter bandwidth surface-density-derived dissimilarity index as compared with census-tract derived dissimilarity is plotted on the y-axis; log of MSA total population count in 2000 is plotted on x-axis. Pearson correlation coefficient is 'r', and corresponding p-value. Line is best fit linear regression. Panels represent MSA's within each of four census regions.
Figure 4
Figure 4
Difference in MSA isolation index when measured using 500 m-egocentric neighborhood versus census tract by region. The arithmetic difference of MSA segregation calculated with 500-meter bandwidth surface-density-derived isolation index as compared with census-tract derived isolation is plotted on the y-axis; log of MSA total population count in 2000 is plotted on x-axis. Pearson correlation coefficient is 'r', and corresponding p-value. Line is best fit linear regression. Panels represent MSA's within each of four census regions.
Figure 5
Figure 5
Difference in MSA dissimilarity index when measured using 4000 m-egocentric neighborhood versus census tract by region. The arithmetic difference of MSA segregation calculated with 4000-meter bandwidth surface-density-derived dissimilarity index as compared with census-tract derived dissimilarity is plotted on the y-axis; log of MSA total population count in 2000 is plotted on x-axis. Pearson correlation coefficient is 'r', and corresponding p-value. Line is best fit linear regression. Panels represent MSA's within each of four census regions.
Figure 6
Figure 6
Difference in MSA isolation index when measured using 4000 m-egocentric neighborhood versus census tract by region. The arithmetic difference of MSA segregation calculated with 4000-meter bandwidth surface-density-derived isolation index as compared with census-tract derived isolation is plotted on the y-axis; log of MSA total population count in 2000 is plotted on x-axis. Pearson correlation coefficient is 'r', and corresponding p-value. Line is best fit linear regression. Panels represent MSA's within each of four census regions.
Figure 7
Figure 7
Residential area racial composition of sub-areas in Atlanta MSA, 2000, using alternate measures. Twenty-county Atlanta MSA distribution of black residents as measured with four methods: A: % black in census tract; B. surface-density-derived proportion black using 500-meter bandwidth kernel; C. population-density-weighted average of 500-meter bandwidth proportion black aggregated to the census tract; D. surface-density-derived proportion black using 4000-meter bandwidth kernel.

Similar articles

Cited by

References

    1. Myrdal G. An American Dilemma: The Negro Problem and Modern Democracy. New York: Harper and Brothers; 1944.
    1. Massey DS, Denton NA. American apartheid : segregation and the making of the underclass. Cambridge, Mass.: Harvard University Press; 1993.
    1. Cutler DM, Glaeser EL, Vigdor JL. The rise and decline of the American ghetto. Journal of Political Economy. 1997;107(3):455–506. doi: 10.1086/250069. - DOI
    1. DuBois WEB. The Philadelphia Negro. Philadelphia: University of Pennsylvania Press; 1899.
    1. Yankauer A. The relationship of fetal and infant mortality to residential segregation: An inquiry into social epidemiology. American Sociological Review. 1950;15(5):644–648. doi: 10.2307/2086918. - DOI

Publication types

MeSH terms

LinkOut - more resources