. 2010 Oct 1;405(1):50-8.
doi: 10.1016/j.ab.2010.06.012. Epub 2010 Jun 9.

Fluorescence-based assays for the assessment of drug interaction with the human transporters OATP1B1 and OATP1B3

Affiliations

Fluorescence-based assays for the assessment of drug interaction with the human transporters OATP1B1 and OATP1B3

Dallas Bednarczyk. Anal Biochem. .

Abstract

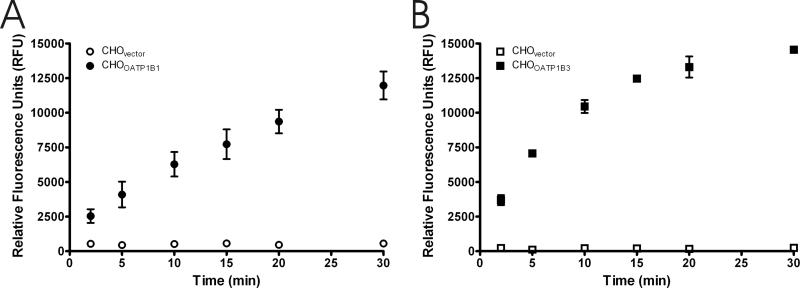
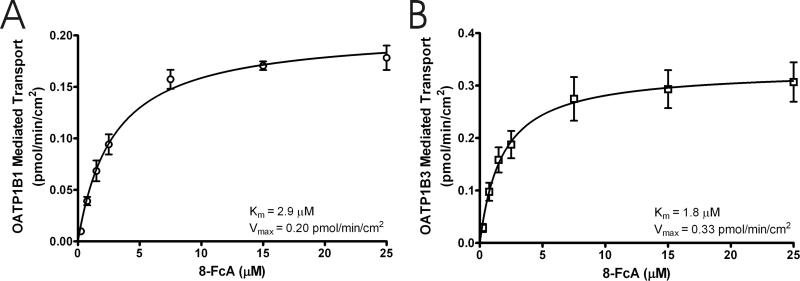
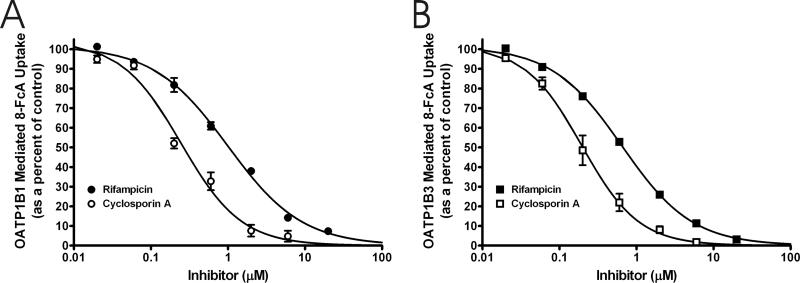
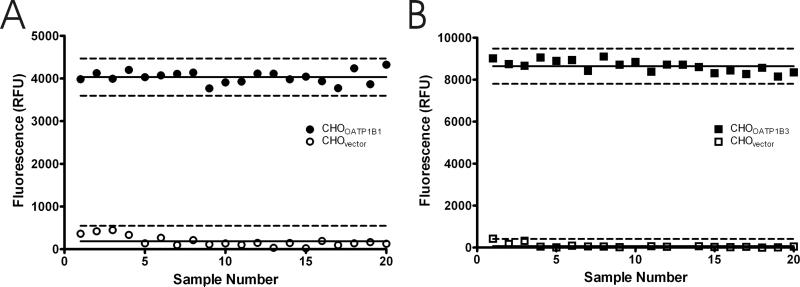
Hepatic disposition plays a significant role in the pharmacokinetics and pharmacodynamics of a variety of drugs. Sinusoidal membrane transporters have been shown to participate in the hepatic disposition of many pharmaceuticals. Two sinusoidal membrane transporters with an established role in hepatic disposition are OATP1B1 and OATP1B3 (organic anion-transporting polypeptides 1B1 and 1B3, respectively). OATP1B1 and OATP1B3 have been implicated in the hepatic uptake of statin drugs, and polymorphisms linked to OATP1B1 have been associated with deleterious patient endpoints. As a result, OATP1B1 and OATP1B3 represent sites for potential drug-drug interactions. Numerous methods exist for identifying potential drug-drug interactions with transporters. However, relatively few offer the convenience and speed of fluorescence-based assays. Here a fluorescence-based assay was developed for measuring the OATP1B1- and OATP1B3-mediated transport of 8-fluorescein-cAMP (8-FcA). The OATP1B1- and OATP1B3-mediated transport of 8-FcA was time dependent and saturable (K(m)=2.9 and 1.8 microM, V(max)=0.20 and 0.33 pmol/min/cm(2), respectively). Molecules known to interact with OATPs, including cyclosporin A, rifampicin, and glibenclamide, each demonstrated concentration-dependent inhibition of 8-FcA transport by OATP1B1 and OATP1B3. The in vitro fluorescence-based assays described here using 8-FcA as the substrate are convenient and rapid and have utility in screening drug candidates for potential drug-drug interactions with OATP1B1 and OATP1B3.


Figures

Figure 1
Figure 1
The cellular accumulation of 8-FcA in transiently transfected CHO cells following a 20 minute exposure to 10 μM 8-FcA. The expressed transporter for each image is as follows: untransfected CHO cells (A), control vector (B), NTCP (C), OAT1 (D), OAT3 (E), OATP1B1 (F), OATP1B3 (G), OATP2B1 (H), OCT1 (I), and OCT2 (J). All images had the same exposure time. Rare cells that accumulated 8-FcA were identified in each transfected condition (arrowheads).
Figure 2
Figure 2
The functional transport by cells transfected with a control vector, OCT1, OCT2, OAT1, NTCP, OATP1B3, OAT3, OATP1B1, or OATP2B1. Data is expressed relative to the control condition (vector). The substrate used for OCT1, OCT2, and the corresponding control was 10 μM metformin. The substrate used for OAT1 and the corresponding control was 2 μM p-aminohippurate (PAH). The substrate used for NTCP and the corresponding control was 2 μM taurocholate (TC). The substrate used for OATP1B3 and the corresponding control was 2 μM bromosulfophthalein (BSP). The substrate used for OAT3, OATP1B1, OATP2B1, and the corresponding control was 2 μM estrone-3-sulfate.
Figure 3
Figure 3
The five minute cellular accumulation of 2 μM estrone-3-sulfate (A), bromosulfophthalein (BSP) (B), dehydroepiandrosterone sulfate (DHEAS) (C), and 8-FcA (D) by CHOvector, CHOOATP1B1, CHOOATP1B3, and CHOOATP2B1 cells. Data is expressed relative to the control condition, CHOvector = 1.
Figure 4
Figure 4
The two-hour cellular accumulation when exposed to 0.1 μM bis-POM-PMEA (solid white and solid black bars) or 1.25 μM 8-FcA (diagonal black stripe on white background and diagonal white stripe on black background) in CHOWT, CHOvector, CHOOATP1B1, CHOOATP1B3 cells in the absence (white background) or presence (black background) of 100 μM indomethacin. Data is expressed relative to the control condition, CHOWT uninhibited = 100%. ND = Not Determined.
Figure 5
Figure 5
Time course of 8-FcA accumulation in CHO cells stably expressing the vector, OATP1B1, or OATP1B3. The 8-FcA concentration for CHOvector and CHOOATP1B1 (A) was 2.5 μM and 1.25 μM for CHOvector and CHOOATP1B3 (B). Data represent the mean and standard error of two experiments where each time point was performed in triplicate.
Figure 6
Figure 6
The concentration dependent transport of 8-FcA by OATP1B1 (A) and OATP1B3 (B). The 8-FcA concentration ranged from 0.25 μM to 25 μM and the period of uptake for each transporter was 10 minutes. The Km and Vmax for each transporter is indicated in the figure. The fit of the kinetic data is shown as a solid line. Data represent the mean and standard error of three experiments where each concentration was performed in triplicate.
Figure 7
Figure 7
The IC50 determination for cyclosporin A (open symbols) and rifampicin (filled symbols) versus 8-FcA for OATP1B1 (A) and OATP1B3 (B). The IC50 values for cyclosporine A and rifampicin against OATP1B1 mediated transport were 0.25 μM, and 0.99 μM, respectively. The IC50 values for the same inhibitors against OATP1B3 mediated transport were 0.20 μM, and 0.65 μM. Data represent the mean and standard error of two experiments where each concentration was performed in triplicate.
Figure 8
Figure 8
Assay data from 20 replicates of CHOvector and CHOOATP1B1 (A), and CHOvector and CHOOATP1B3 (B). The mean of each data set is indicated by the solid horizontal line. The broken lines represent three standard deviations from the mean. The calculated Z’-factor was 0.79 for the OATP1B1 assay and 0.86 for the OATP1B3 assay.

Similar articles

Cited by

References

    1. Ho RH, Kim RB. Transporters and drug therapy: implications for drug disposition and disease. Clin. Pharmacol. Ther. 2005;78:260–277. - PubMed
    1. Kola I, Landis J. Can the pharmaceutical industry reduce attrition rates? Nat. Rev. Drug Discov. 2004;3:711–716. - PubMed
    1. International Transporter Consortium KM, Giacomini SM, Huang DJ, Tweedie LZ, Benet KL, Brouwer X, Chu A, Dahlin R, Evers V, Fischer KM, Hillgren KA, Hoffmaster T, Ishikawa D, Keppler RB, Kim CA, Lee M, Niemi JW, Polli Y, Sugiyama PW, Swaan JA, Ware SH, Wright SW, Yee MJ, Zamek-Gliszczynski L. Zhang, Membrane transporters in drug development. Nat. Rev. Drug. Discov. 2010;9:215–236. - PMC - PubMed
    1. Crespi CL, Stresser DM. Fluorometric screening for metabolism-based drug-drug interactions. J. Pharmacol. Toxicol. Methods. 2000;44:325–331. - PubMed
    1. Ahlin G, Karlsson J, Pedersen JM, Gustavsson L, Larsson R, Matsson P, Norinder U, Bergström CAP. Artursson, Structural requirements for drug inhibition of the liver specific human organic cation transport protein. J. Med. Chem. 2008;51:5932–5942. - PubMed

Publication types

MeSH terms