doi: 10.1016/j.heares.2010.05.001.
The remarkable cochlear amplifier
Affiliations
- PMID: 20541061
- PMCID: PMC6366996
- DOI: 10.1016/j.heares.2010.05.001
Item in Clipboard
The remarkable cochlear amplifier
Hear Res.
2010 Jul.
Erratum in
- Hear Res. 2011 Oct;280(1-2):245. Sacchi, J R Santos [corrected to Santos-Sacchi, J]
Abstract
This composite article is intended to give the experts in the field of cochlear mechanics an opportunity to voice their personal opinion on the one mechanism they believe dominates cochlear amplification in mammals. A collection of these ideas are presented here for the auditory community and others interested in the cochlear amplifier. Each expert has given their own personal view on the topic and at the end of their commentary they have suggested several experiments that would be required for the decisive mechanism underlying the cochlear amplifier. These experiments are presently lacking but if successfully performed would have an enormous impact on our understanding of the cochlear amplifier.
Figures
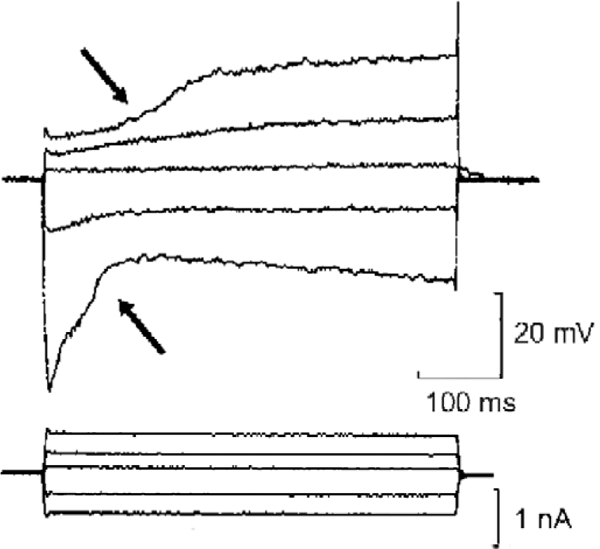
Current-induced OHC movement. A microelectrode recording of potentials in an isolated guinea pig OHC during current injection, ca. 1983. Allowing for a low resting potential (ca.−30 mV), the voltage-current curves match data subsequently obtained by patch clamp recordings. The voltage distortions during current injection (arrowed) are almost certainly the result of the OHC changing length during the commands (Ashmore, unpublished).
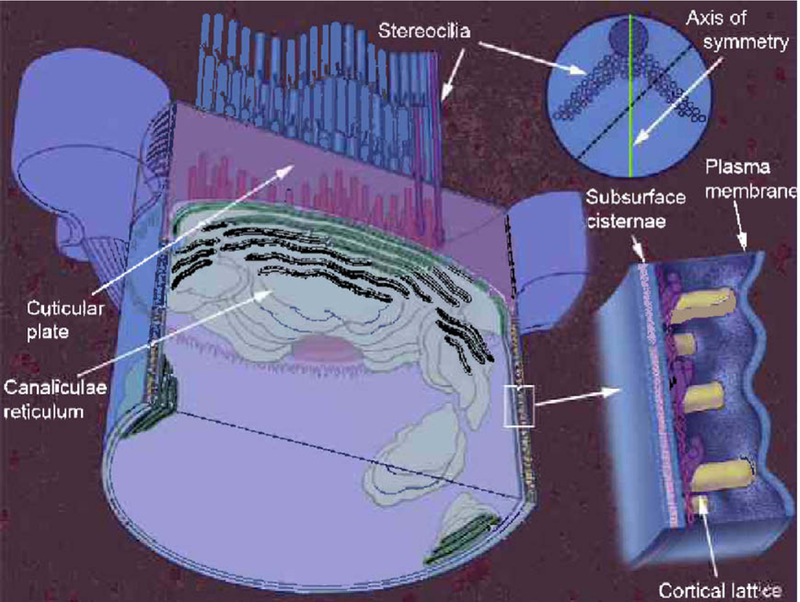
Membrane organization of the outer hair cell stereocilia bundle and lateral wall. Both the apical pole and the lateral wall are composed of three layers. The plasma membrane is the outermost layer in both locations. The innermost layer is composed of a membrane bound organelle called the canalicular reticulum in the apex and the subsurface cisterna in the lateral wall. In between outer and inner membrane layers is a cytoskeletal structure called the cuticular plate at the apex and the cortical lattice in the lateral wall. Insert on the right portrays a high power rendering of the outer hair cell lateral wall. Insert at upper right is a view of the apical end showing the plane at which the outer hair cell has been opened. Adapted from Fig. 1 in Brownell, 2002.
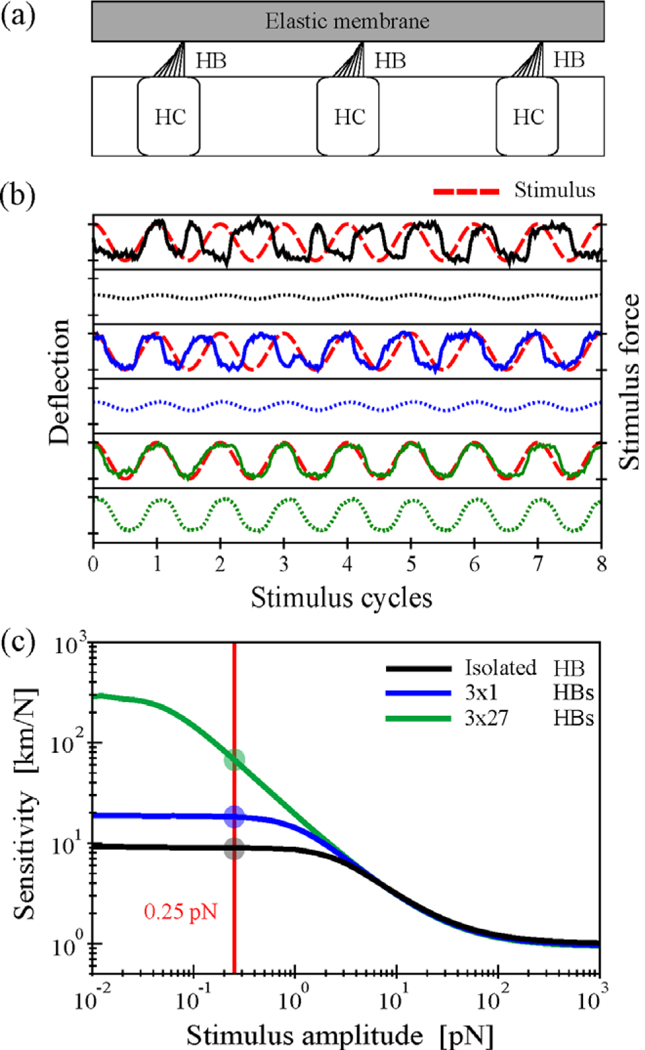
(a) Schematic of three hair cells (HC) with their hair-bundles (HB) coupled elastically via an overlying membrane. (b) Illustration of phase-locking for an isolated (black) and the central hair-bundle of groups of coupled hair-bundles (3 × 1 HBs, blue; 3 × 27 HBs, green). Sample trajectories of simulation results (solid lines) are shown together with the periodic stimulus force F(t) = Acos(2πf0t) with A = 0.25 pN (broken red line) for coupling stiffness matched to stereociliar pivotal stiffness, K = Ksp = 0.6 pN/nm. Each system is driven at its characteristic frequencyf0 (f0= 8.91 Hz (1 × 1), 9.90Hz (3 × 1), 10.54Hz (3 × 27)). The respective time-dependent average responses over many repetitions of the stimulus are shown as dotted lines below. Distance between ticks is 40 nm for deflection and 0.5 pN for stimulus force. (c) Nonlinear response of coupled hair-bundles. For the three systems studied in (b) the sensitivity (average response amplitude divided by stimulus amplitude) is displayed as a function of stimulus amplitude. The red vertical line indicates the stimulus force used in (b). Note that the sensitivity to weak stimuli and the amplitude range of nonlinear compression increase with increasing system size.
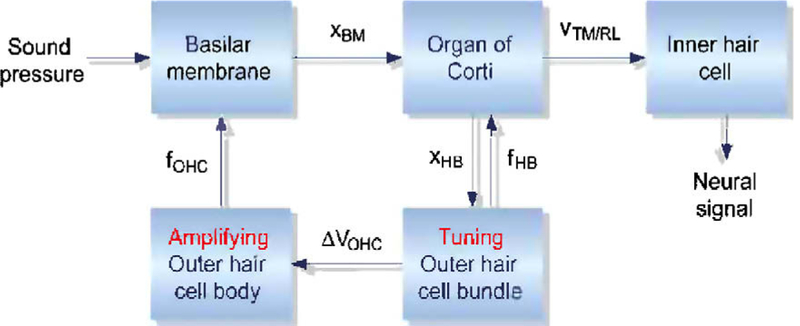
Process involved in the cochlear amplifier. Sound causes displacements of the basilar membrane, XBM, and organ of Corti leading to deflection of the OHC hair-bundle, XHB. Activation and adaptation of the mechanotransducer channels generate a tuned transducer current culminating in a change in OHC membrane potential, DVOHC, that drives the somatic motor. The force, fOHC, produced by OHC electromotility augments basilar membrane motion and may also deform the organ of Corti (Mammano and Ashmore, 1993). Gating of the mechanotransducer channels may generate sufficient force, fHB, to move the hair-bundles (the hair-bundle motor) and the organ of Corti. The inner hair cell bundles are stimulated by the relative velocity, VTM/RL, between tectorial membrane and reticular lamina
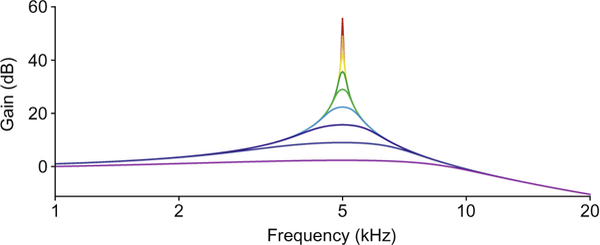
The characteristic features of a critical oscillator emerge in a doubly logarithmic plot of the relation between stimulus frequency and gain for a series of sinusoidal stimuli. Gain is defined as the ratio of the oscillator’s sensitivity to a given stimulus to that evoked by intense stimulation at the same frequency. A weak stimulus evokes a sharply tuned response with high gain. As the stimulus level rises in 10-dB increments, the gain at the characteristic frequency of 5 kHz declines as the two-thirds power of the stimulus amplitude and the bandwidth of amplification increases. Although the system displays compressive nonlinearity near resonance, its behavior remains linear for stimulus frequencies that differ significantly from the characteristic frequency of the critical oscillator.
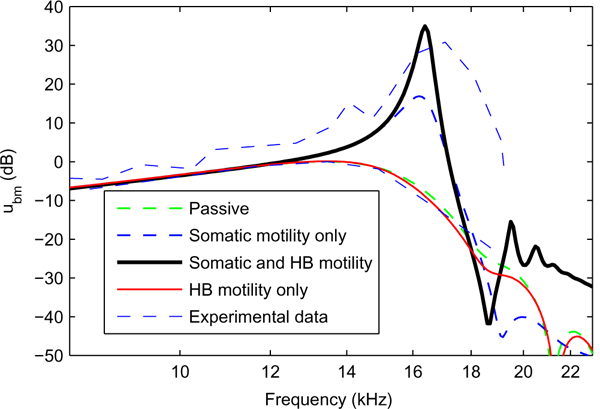
Response of the BM to acoustic stimulation at the 17 kHz best place. The responses are normalized to the maximum passive BM response. The model predictions are compared to measurements from de Boer and Nuttall, 2000 at 20 and 100 dB SPL (thin blue dashed lines). The parameters used in the simulations are, for OHC somatic motility, ϵ3 = –8.4 × 10⁶ N/m/mv and for HB motility The passive model prediction (thick green dashed line) follows closely the measurements at 100 dB SPL. When somatic motility is included (thick blue dashed line), the peak gain is about 20 dB higher than in the passive case and the tuning of the response is sharper as in the experimental data at 20 dB SPL. When somatic motility and HB motility are included (thick solid black line), the gain is about 10 dB higher than in the previous case. For the case when only HB motility is included (red solid line), the response is almost the same as the passive model response.
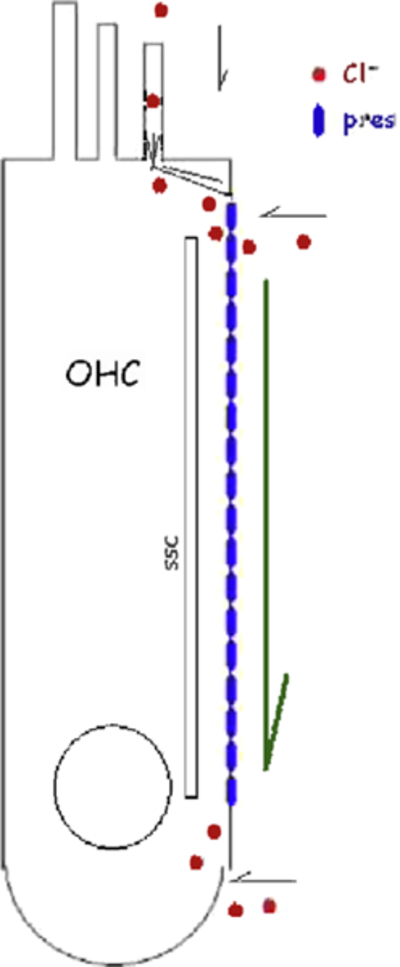
The OHC is anion driven. The schematic illustrates the possible routes that chloride may take to alter prestin activity intracellularly. We have already shown that the expanse of the lateral membrane fluxes chloride via the mechanically active GmetL (Rybalchenko and Santos-Sacchi, 2003). Other proposed routes are through the stereociliary MET channel directly, or via rootlet perturbations of GmetL. Chloride may also flux during efferent activation of GABA receptors.
References
-
- Allen JB, 1980. Cochlear micromechanics-a physical model of transduction. J. Acoust. Soc. Am. 68, 1660–1670. - PubMed
-
- Anvari B, Zhang R, Qian F, Rajagopalan L, Pereira FA, Brownell WE, 2007. Effects of prestin on membrane mechanics and electromechanics. Conf. Proc. IEEE Eng. Med. Biol. Soc. 68, 5384–5386. - PubMed
-
- Ashmore J, 2008. Cochlear outer hair cell motility. Physiol. Rev. 88,173–210. - PubMed
-
- Avan P, Bonfils P, Gilain L, Mom T, 2003. Physiopathological significance of distortion-product otoacoustic emissions at 2f1-f2 produced by high-versus low-level stimuli. J. Acoust. Soc. Am. 113, 430–441. - PubMed
Publication types
MeSH terms
Grants and funding
- R01 DC008130/DC/NIDCD NIH HHS/United States
- R01 DC001362/DC/NIDCD NIH HHS/United States
- NIH-NIDCD RO1 DC01362/PHS HHS/International
- NIDCD DC00273/PHS HHS/International
- NIH-NIDCD R01-04084/PHS HHS/International
- F32 DC000354/DC/NIDCD NIH HHS/United States
- R01 DC009913/DC/NIDCD NIH HHS/United States
- R01 DC004084/DC/NIDCD NIH HHS/United States
- R01 DC000273/DC/NIDCD NIH HHS/United States
- DC009913/DC/NIDCD NIH HHS/United States
- R01 DC000089/DC/NIDCD NIH HHS/United States
- R01 DC002775/DC/NIDCD NIH HHS/United States
- DC000354/DC/NIDCD NIH HHS/United States
- DC00089-38/DC/NIDCD NIH HHS/United States
- DC008130/DC/NIDCD NIH HHS/United States
- R01 DC000354/DC/NIDCD NIH HHS/United States
- R01-DC002775/DC/NIDCD NIH HHS/United States
LinkOut - more resources
Full Text Sources