. 2010 Jul 13;20(13):1209-15.
doi: 10.1016/j.cub.2010.05.029. Epub 2010 Jun 10.

Clock and cycle limit starvation-induced sleep loss in Drosophila

Affiliations

Clock and cycle limit starvation-induced sleep loss in Drosophila

Alex C Keene et al. Curr Biol. .

Abstract

Neural systems controlling the vital functions of sleep and feeding in mammals are tightly interconnected: sleep deprivation promotes feeding, whereas starvation suppresses sleep. Here we show that starvation in Drosophila potently suppresses sleep, suggesting that these two homeostatically regulated behaviors are also integrated in flies. The sleep-suppressing effect of starvation is independent of the mushroom bodies, a previously identified sleep locus in the fly brain, and therefore is regulated by distinct neural circuitry. The circadian clock genes Clock (Clk) and cycle (cyc) are critical for proper sleep suppression during starvation. However, the sleep suppression is independent of light cues and of circadian rhythms as shown by the fact that starved period mutants sleep like wild-type flies. By selectively targeting subpopulations of Clk-expressing neurons, we localize the observed sleep phenotype to the dorsally located circadian neurons. These findings show that Clk and cyc act during starvation to modulate the conflict of whether flies sleep or search for food.


Figures

Figure 1
Figure 1. Food deprivation suppresses sleep
A. Paradigm for measuring the effects of starvation on sleep. Experiments took place over a 3-day period that began 1 day following the loading of flies into standard DAMS tubes. Baseline (Day 1): all groups were kept on food. Experiment (Day 2): flies were transferred to fresh food (control, yellow), 150mM sucrose (red), or agar (food deprivation; blue). Recovery (Day 3): All groups were transferred to fresh food. B. Sleep profile of male flies reveals that starvation (agar group, blue line) suppresses sleep compared to food (black line) and sucrose (red line) fed flies during the experimental day (grey bar). Days on food (1 and 3) are depicted by yellow bars. White/black bars indicate lights on/lights off. C, D. Quantification of day (white bars) and night (black bars) sleep over 24hrs reveals decreased sleep during the night in male (C) and female (D) flies in the agar group compared to food (male, N≥49; for all groups; P<0.001: female, N≥42; for all groups: P<0.001) and sucrose-fed (male: P<0.001; female: P<0.001) fed controls. Male flies fed agar did not differ in daytime sleep compared to baseline (P>0.146) while the female agar group suppressed sleep during the day (P<0.001). Sucrose is sufficient to support normal sleep in daytime and nighttime (male, P>0.35; female, P>0.084). E. Percentage change from baseline sleep reveals that male and female flies on agar suppress sleep compared the food and sucrose groups (P<0.001, all groups). F. Starvation starting at ZT0 (N≥26) suppresses sleep during the following night (ZT12–24; P<0.0001), while flies starved at ZT12 suppress sleep during the following day (ZT0–12; P<0.001). In both cases, no statistical difference is observed for hours 0–12 of starvation (P>0.171, P>0.089). G. Male flies were tracked in square arenas (N≥31; left) or tubes (N≥25; right). Daytime and nighttime sleep was significantly suppressed in the agar groups (square arena, P<0.01; tube, P<0.01). Sucralose fed flies in tubes suppressed both daytime and nighttime sleep compared to food and sucrose fed controls (P<0.001). Daytime sleep (ZT0–12) did not differ between the agar and sucralose groups (P>0.63). Asterisk denotes significant difference (P<0.01, ANOVA) from control groups. Data are mean ± SEM. See also Figure S1.
Figure 2
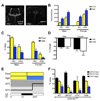
Figure 2. Mushroom bodies are dispensable for sleep-feeding interactions
A. Hydroxyurea ablation of the mushroom bodies. Anti-FAS-II staining labels the mushroom bodies and central complex of a representative brain from an untreated –HU fly (left). While the central complex is intact, the mushroom bodies are not detectable in brains from +HU flies (right). B. Total 24hr activity reveals that both −HU and +HU flies are more active on agar than on food (N≥33 for all groups; Male, −HU; P<0.001, +HU; P<0.004: Female, −HU; P<0.002, +HU; P<0.001). −HU flies are also less active than +HU flies (Male; P<0.001; Female; P<0.001). C. Percentage of sleep per 24hr reveals that both −HU and +HU flies suppress sleep on agar compared to flies on food (Male, −HU; P<0.001, +HU; P<0.001: Female, −HU; P<0.001, +HU; P<0.003). D. Suppression of sleep calculated as mean percentage change/fly reveals that in both male and female flies sleep suppression during starvation is not significantly affected by HU treatment (Male; P>0.84; Female; P>0.54). E. Schematic of the heat and feeding protocol for silencing the mushroom body with ShiTS1. Flies in the agar group are starved beginning at ZT18, 6hr prior to temperature shift. F. Flies with silenced mushroom body neurons suppress sleep on agar at 30°C compared to flies on food at 30°C. Data depict the percentage of time spent sleeping from ZT0–ZT12 (N≥16 for all groups; ShiTS1/+ =P<0.006; H24= P<0.001; OK107=P<0.01; c747; P<0.01). Asterisk denotes significant difference (P<0.01, ANOVA) from control groups. Data are mean ± SEM.
Figure 3
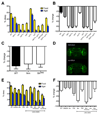
Figure 3. Mutations in Clk and cyc enhance sleep-suppression during starvation
A. Male flies with mutations in Clk and cyc were tested for sleep in tubes containing food or agar. In all groups tested, flies slept less on agar than on food (N≥41; P<0.001 for all groups). B. Calculating percentage change in sleep reveals Clkar, ClkJrk, and cyc0 flies significantly enhanced sleep suppression during starvation compared to wild type controls (P<0.001 for all groups). Sleep suppression in flies heterozygous for ClkJrk (ClkJrk/+) does not differ from ClkJrk homozygous flies (P>0.38) and is greater than wild type controls (P<0.001). Clkar/+,cyc0/+ heterozygous flies enhance sleep suppression compared to wild type and Clkar/+, and cyc0/+ heterozygous flies (P<0.01 for all groups). C. The short-sleep mutants fmn and ShMNS suppress sleep comparably to wild type flies (P>0.75). D. Whole-brain confocal images of Pdf-GAL4 and cry-Gal4 driving UAS-mCD8:GFP reveals the expression pattern of each driver. E. Male flies expressing UAS-ClkDN with tim-GAL4 and cry-GAL4 show enhanced sleep suppression when starved. All groups tested significantly suppress sleep on agar compared to food (N≥28; P<0.001 for both groups). F. Analyzing data in panel D as percentage of sleep suppression between flies on food or agar reveals that tim-GAL4;Pdf-GAL80;UAS-ClkDN flies suppress sleep significantly more than wild type flies and those harboring UAS-ClkDN or GAL4 transgenes alone (P<0.001 for all groups). Asterisk denotes significant difference (P<0.01, ANOVA) from control groups. Data are mean ± SEM. See also Figure S2 and Table S1.
Figure 4
Figure 4. Clk/ cyc expressing neurons acutely regulate sleep during starvation
A. Schematic of the restricted temperature shift and feeding protocol for ShiTS1 manipulations. Flies on agar were food deprived for 12hrs during the temperature shift (N≥22; ZT0–ZT12). B. Blocking transmission from tim or Clk-GAL4 neurons suppressed sleep in starved flies. All flies harbor UAS-ShiTS1. Control (UAS-ShiTS1/+) and Pdf-GAL4;UAS-ShiTS1 flies do not suppress sleep at 30°C in the restricted starvation protocol (P>0.11; P>0.79), while tim-GAL4;UAS-ShiTS1 and Clk-GAL4;UAS-ShiTS1 flies sleep significantly less on agar than on food (P<0.001; P<0.001). C. Analyzing data as percentage change from fed flies at 22°C reveals that starved UAS-ShiTS1/+ and Pdf-GAL4;UAS-ShiTS1 did not differ from fed flies (P>0.62) while tim-GAL4;UAS-ShiTS1 and Clk-GAL4;UAS-ShiTS1 suppress sleep when starved (P>0.001) D. Schematic of the temperature shift and feeding protocol for dTrpA1 manipulations. Flies on agar were food deprived for 18 hrs beginning at ZT18, 6 hrs prior to the temperature shift (N≥23; ZT0–ZT12). E. Acute excitation of cry-GAL4 expressing neurons blocks the effects of starvation on sleep. All flies harbor UAS-dTrpA1. Control flies (UAS-dTrpA1/+) and Pdf-GAL4;UAS -dTrpA1 flies suppress sleep at 28°C (P<0.003; P<0.007), while cry-GAL4;UAS-dTrpA1 flies do not suppress sleep during starvation (P>0.71). F. Analyzing data as percentage change from fed flies at 22°C reveals starved UAS-TrpA1/+ and Pdf-GAL4;UAS-TrpA1 suppress sleep compared to fed controls at 30°C (P<0.001) while starved cry-GAL4;UAS-TrpA1 do not differ from fed controls (P>0.56) Asterisk denotes significant difference (P<0.01, ANOVA) from control groups. Data are mean ± SEM.

Similar articles

Cited by

References

    1. Horne J. REM sleep, energy balance and 'optimal foraging'. Neurosci Biobehav Rev. 2009;33:466–474. - PubMed
    1. Taheri S, Lin L, Austin D, Young T, Mignot E. Short sleep duration is associated with reduced leptin, elevated ghrelin, and increased body mass index. PLoS Med. 2004;1:e62. - PMC - PubMed
    1. Rechtschaffen A, Bergmann BM. Sleep deprivation in the rat: an update of the 1989 paper. Sleep. 2002;25:18–24. - PubMed
    1. MacFadyen UM, Oswald I, Lewis SA. Starvation and human slow-wave sleep. J Appl Physiol. 1973;35:391–394. - PubMed
    1. Chemelli RM, Willie JT, Sinton CM, Elmquist JK, Scammell T, Lee C, Richardson JA, Williams SC, Xiong Y, Kisanuki Y, et al. Narcolepsy in orexin knockout mice: molecular genetics of sleep regulation. Cell. 1999;98:437–451. - PubMed

Publication types

LinkOut - more resources