

Transient frictional slip between integrin and the ECM in focal adhesions under myosin II tension
- PMID: 20541412
- PMCID: PMC2902720
- DOI: 10.1016/j.cub.2010.05.049
Transient frictional slip between integrin and the ECM in focal adhesions under myosin II tension
Abstract
Background: The spatiotemporal regulation of adhesion to the extracellular matrix is important in metazoan cell migration and mechanosensation. Although adhesion assembly depends on intracellular and extracellular tension, the biophysical regulation of force transmission between the actin cytoskeleton and extracellular matrix during this process remains largely unknown.
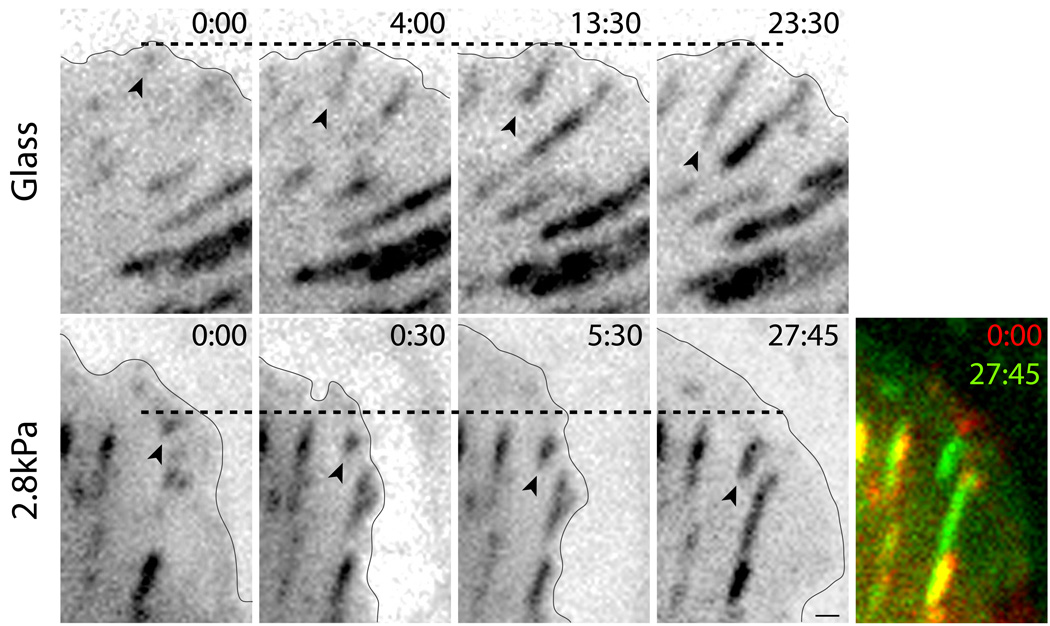
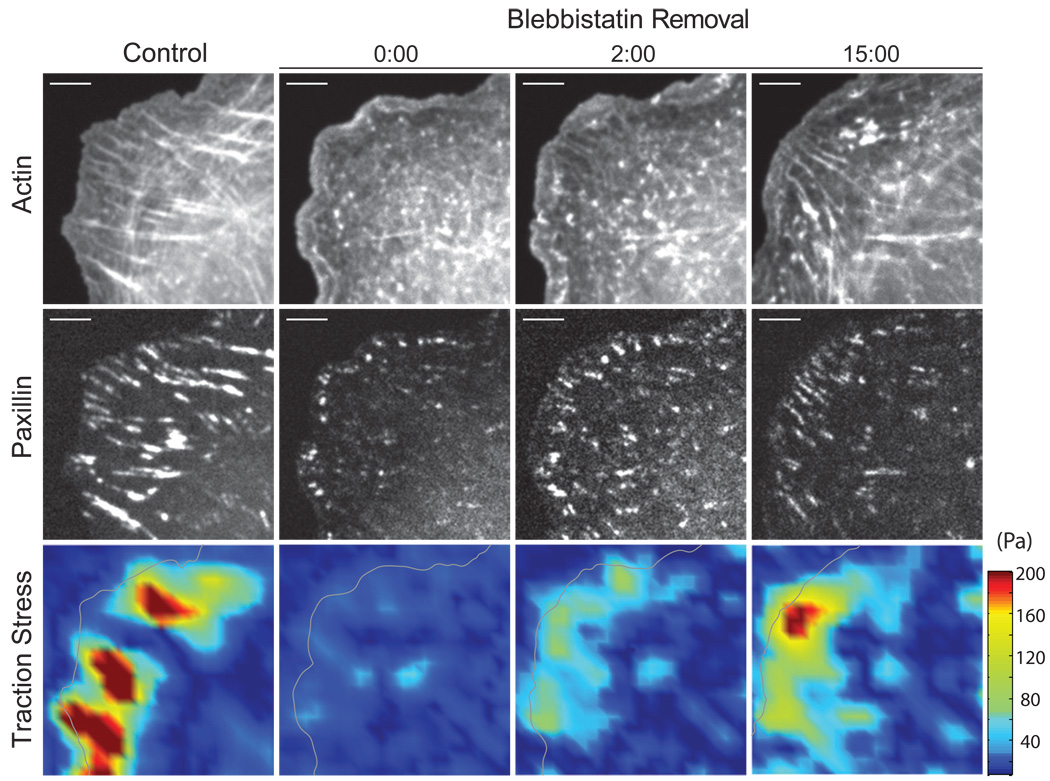
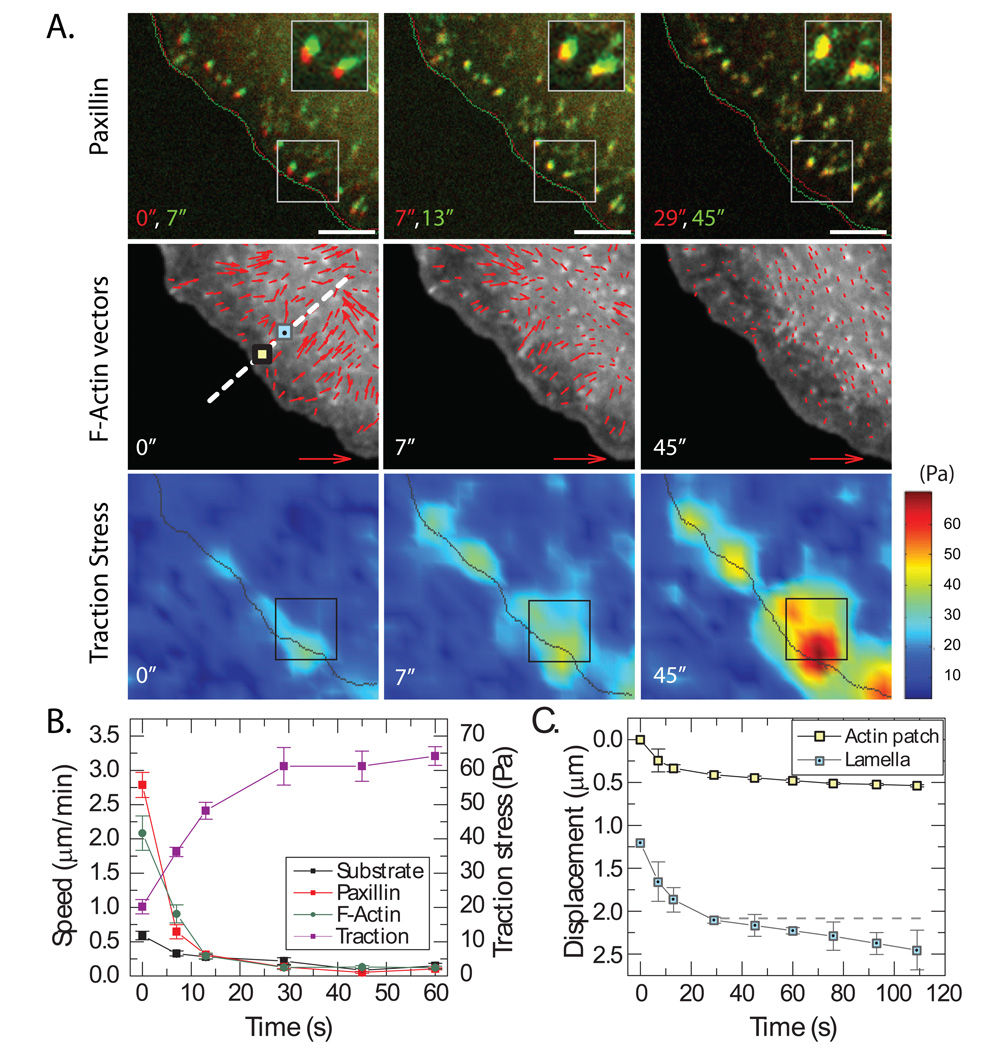
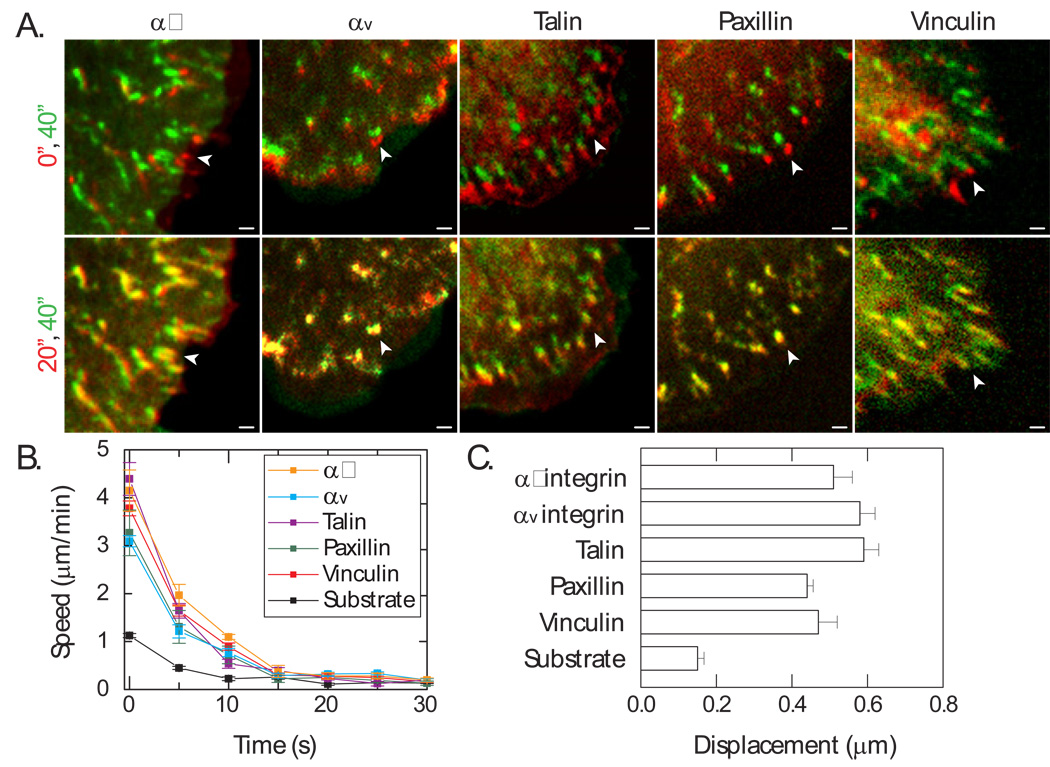
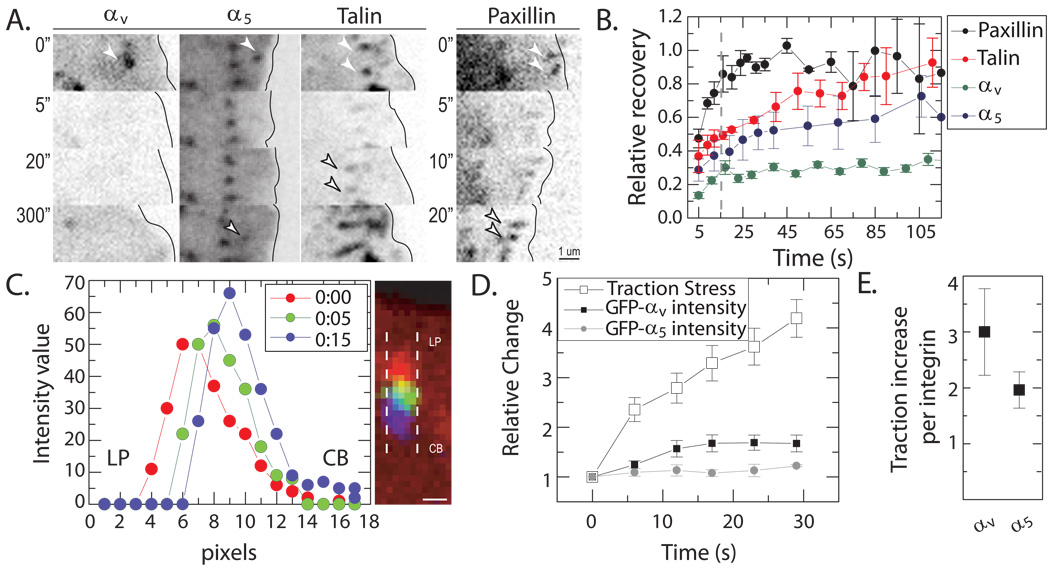
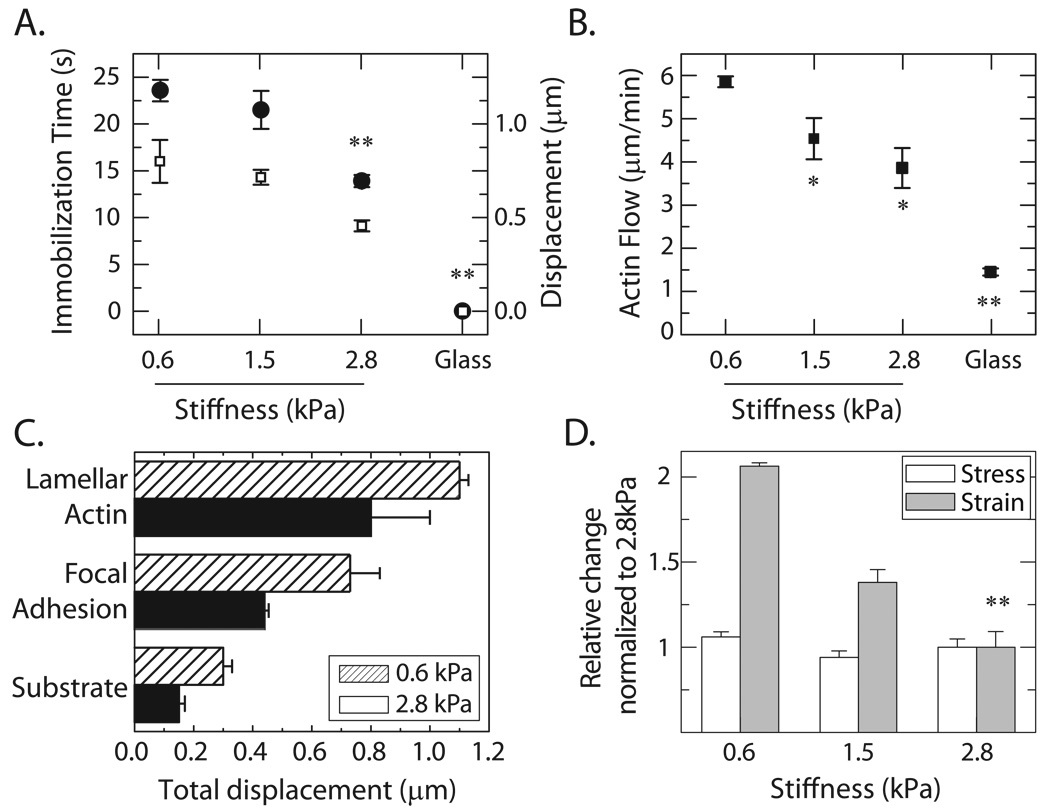
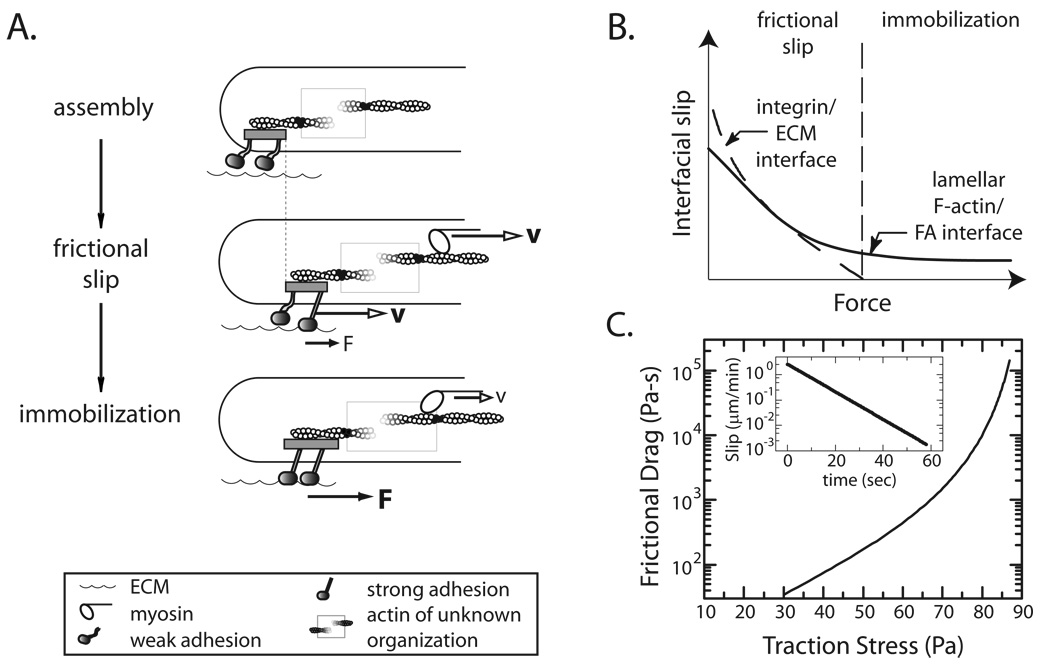
Results: To elucidate the nature of force transmission as myosin II tension is applied to focal adhesions, we correlated the dynamics of focal adhesion proteins and the actin cytoskeleton to local traction stresses. Under low extracellular tension, newly formed adhesions near the cell periphery underwent a transient retrograde displacement preceding elongation. We found that myosin II-generated tension drives this mobility, and we determine the interface of differential motion, or "slip," to be between integrin and the ECM. The magnitude and duration of both adhesion slip and associated F-actin dynamics is strongly modulated by ECM compliance. Traction forces are generated throughout the slip period, and adhesion immobilization occurs at a constant tension.
Conclusions: We have identified a tension-dependent, extracellular "clutch" between integrins and the extracellular matrix; this clutch stabilizes adhesions under myosin II driven tension. The current work elucidates a mechanism by which force transmission is modulated during focal adhesion maturation.
Copyright 2010 Elsevier Ltd. All rights reserved.
Figures
Comment in
-
Cell-matrix adhesion: slip and immobilization under force.Curr Biol. 2010 Aug 24;20(16):R669-71. doi: 10.1016/j.cub.2010.06.030. Curr Biol. 2010. PMID: 20728050
Similar articles
-
Cell-matrix adhesion: slip and immobilization under force.Curr Biol. 2010 Aug 24;20(16):R669-71. doi: 10.1016/j.cub.2010.06.030. Curr Biol. 2010. PMID: 20728050
-
Nanopatterning reveals an ECM area threshold for focal adhesion assembly and force transmission that is regulated by integrin activation and cytoskeleton tension.J Cell Sci. 2012 Nov 1;125(Pt 21):5110-23. doi: 10.1242/jcs.108035. Epub 2012 Aug 16. J Cell Sci. 2012. PMID: 22899715 Free PMC article.
-
Tension is required but not sufficient for focal adhesion maturation without a stress fiber template.J Cell Biol. 2012 Feb 6;196(3):363-74. doi: 10.1083/jcb.201107042. Epub 2012 Jan 30. J Cell Biol. 2012. PMID: 22291038 Free PMC article.
-
Mechanosensitivity and compositional dynamics of cell-matrix adhesions.EMBO Rep. 2013 Jun;14(6):509-19. doi: 10.1038/embor.2013.49. Epub 2013 May 17. EMBO Rep. 2013. PMID: 23681438 Free PMC article. Review.
-
Molecular mechanisms underlying the force-dependent regulation of actin-to-ECM linkage at the focal adhesions.Prog Mol Biol Transl Sci. 2014;126:135-54. doi: 10.1016/B978-0-12-394624-9.00006-3. Prog Mol Biol Transl Sci. 2014. PMID: 25081617 Review.
Cited by
-
STICCS reveals matrix-dependent adhesion slipping and gripping in migrating cells.Biophys J. 2012 Oct 17;103(8):1672-82. doi: 10.1016/j.bpj.2012.08.060. Epub 2012 Oct 16. Biophys J. 2012. PMID: 23083710 Free PMC article.
-
Mean deformation metrics for quantifying 3D cell-matrix interactions without requiring information about matrix material properties.Proc Natl Acad Sci U S A. 2016 Mar 15;113(11):2898-903. doi: 10.1073/pnas.1510935113. Epub 2016 Feb 29. Proc Natl Acad Sci U S A. 2016. PMID: 26929377 Free PMC article.
-
Nucleation and decay initiation are the stiffness-sensitive phases of focal adhesion maturation.Biophys J. 2011 Dec 21;101(12):2919-28. doi: 10.1016/j.bpj.2011.11.010. Epub 2011 Dec 20. Biophys J. 2011. PMID: 22208190 Free PMC article.
-
Extracellular Matrix Geometry and Initial Adhesive Position Determine Stress Fiber Network Organization during Cell Spreading.Cell Rep. 2019 May 7;27(6):1897-1909.e4. doi: 10.1016/j.celrep.2019.04.035. Cell Rep. 2019. PMID: 31067472 Free PMC article.
-
Force-dependent focal adhesion assembly and disassembly: A computational study.PLoS Comput Biol. 2023 Oct 6;19(10):e1011500. doi: 10.1371/journal.pcbi.1011500. eCollection 2023 Oct. PLoS Comput Biol. 2023. PMID: 37801464 Free PMC article.
References
-
- Berrier AL, Yamada KM. Cell-matrix adhesion. J Cell Physiol. 2007;213:565–573. - PubMed
-
- Yeung T, Georges PC, Flanagan LA, Marg B, Ortiz M, Funaki M, Zahir N, Ming W, Weaver V, Janmey PA. Effects of substrate stiffness on cell morphology, cytoskeletal structure, and adhesion. Cell Motil Cytoskeleton. 2005;60:24–34. - PubMed
-
- Choquet D, Felsenfeld DP, Sheetz MP. Extracellular matrix rigidity causes strengthening of integrin-cytoskeleton linkages. Cell. 1997;88:39–48. - PubMed
Publication types
MeSH terms
Substances
Grants and funding
LinkOut - more resources
Full Text Sources
Other Literature Sources
