. 2010 Jun 9;18(6):677-87.
doi: 10.1016/j.str.2010.03.001.

Three-dimensional structure of TspO by electron cryomicroscopy of helical crystals

Affiliations

Three-dimensional structure of TspO by electron cryomicroscopy of helical crystals

Vladimir M Korkhov et al. Structure. .

Abstract

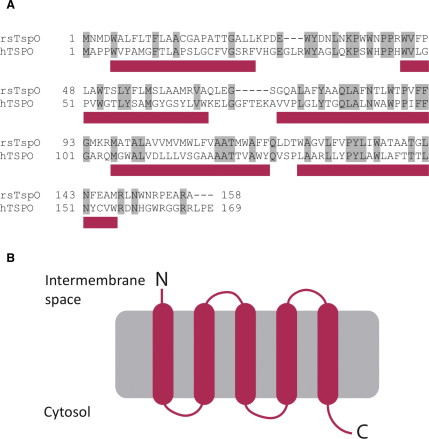
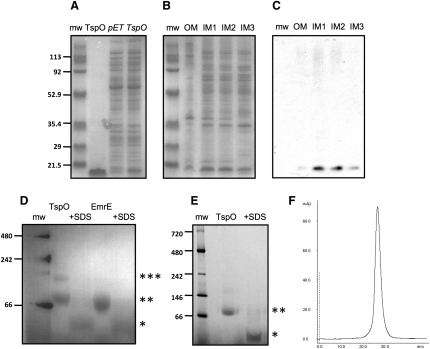
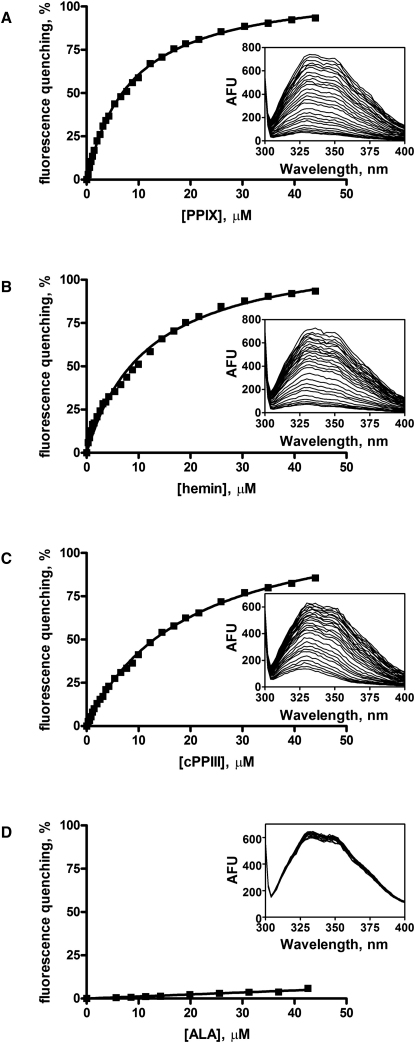
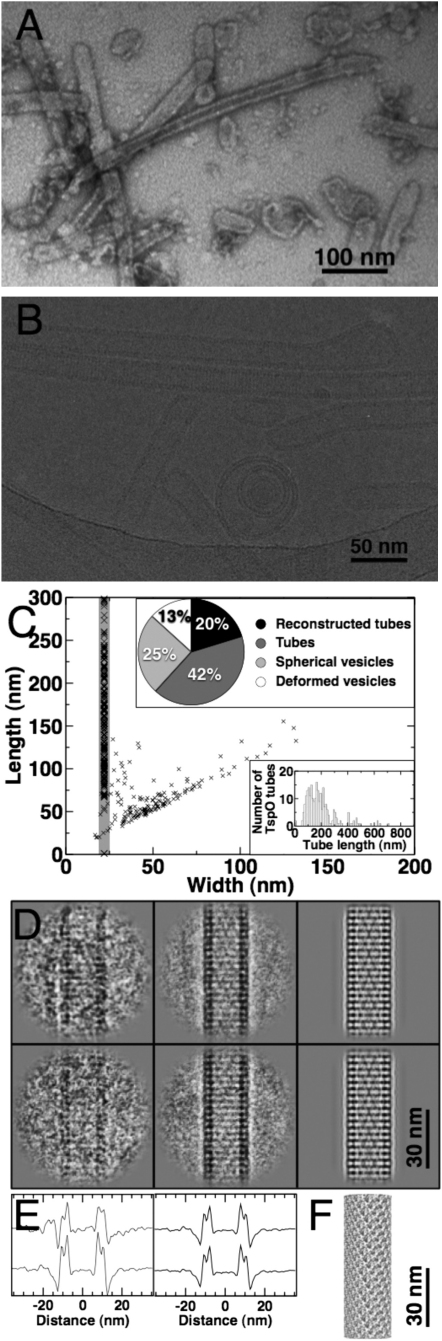
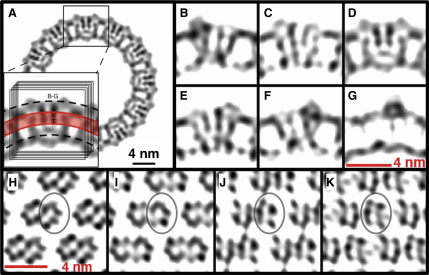
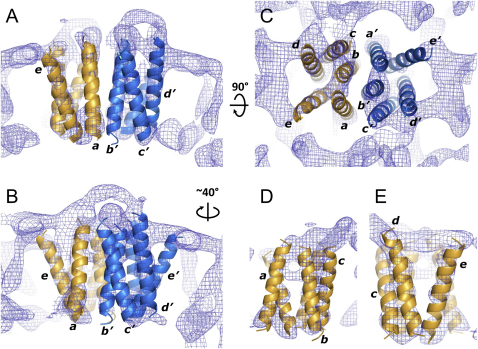
The 18 kDa TSPO protein is a polytopic mitochondrial outer membrane protein involved in a wide range of physiological functions and pathologies, including neurodegeneration and cancer. The pharmacology of TSPO has been extensively studied, but little is known about its biochemistry, oligomeric state, and structure. We have expressed, purified, and characterized a homologous protein, TspO from Rhodobacter sphaeroides, and reconstituted it as helical crystals. Using electron cryomicroscopy and single-particle helical reconstruction, we have determined a three-dimensional structure of TspO at 10 A resolution. The structure suggests that monomeric TspO comprises five transmembrane alpha helices that form a homodimer, which is consistent with the dimeric state observed in detergent solution. Furthermore, the arrangement of transmembrane domains of individual TspO subunits indicates a possibility of two substrate translocation pathways per dimer. The structure provides the first insight into the molecular architecture of TSPO/PBR protein family that will serve as a framework for future studies.


Figures

Figure 1
Figure 1
Comparison of Sequence and Topology of the Human and Bacterial TspO Homologues (A) Alignment between the amino acid sequences of human TSPO (hTSPO) and TspO from R. sphaeroides (rsTspO). Bars underneath the sequences represent hydrophobic regions that are predicted by hydropathy analysis to form transmembrane domains. (B) Cartoon of the predicted topology of R. sphaeroides TspO based on hydropathy analysis and the “positive inside” rule.
Figure 2
Figure 2
Dimeric TspO Is Expressed in the E. coli Inner Membrane (A) TspO protein expression was confirmed by Coomassie blue staining of the SDS-PAGE gel. TspO was enriched in a small-scale batch NiNTA purification procedure in DDM (lane TspO) and compared with control cells (lane pET). DDM-purified TspO is shown for comparison (lane TspO). (B and C) Fractionation of the TspO-expressing BL21(DE3) cell membranes. Lane OM corresponds to the outer membrane; lanes IM1–IM3 correspond to the inner membrane band (IM2) and the flanking fractions IM1 and IM3 that also contained inner membrane material. The gel in (B) was stained with Coomassie blue, whereas (C) is a western blot of an identical gel probed with an anti-poly His antibody to identify the position of recombinant TspO. (D and E) Blue native PAGE of purified TspO and purified EmrE. The asterisk indicates the monomeric species formed upon addition of 1% SDS for 10 min prior to the addition of the loading dye (+SDS). As a control, a standard dimeric membrane protein of a comparable size (15.2 kDa including the C-terminal tag), EmrE, is shown. Two and three asterisks indicate dimeric and multimeric protein species, respectively. If TspO is concentrated to below 5 mg/ml, the multimeric band is negligible (E). (F) Size exclusion chromatography profile of TspO in DDM.
Figure 3
Figure 3
Binding of Substrates to TspO TspO purified in DDM was titrated with increasing amounts of PPIX (A), hemin (B), and cPPIII (C) and the tryptophan fluorescence was measured at 340 nm. For comparison, the measurements using the nontransported molecule D-aminolevulinic acid (ALA) is shown in (D). The tryptophan fluorescence emitted at 340 nm was plotted against the concentration of the quenching reagent to obtain a dose-response curve. The insets in each graph show the raw spectra in the 300 to 400 nm range. The data shown are the representative dose-dependence profiles of the tryptophan fluorescence quenching by the indicated substances; the number of experiments for PPIX, hemin, and cPPIII were three, two, and two, respectively.
Figure 4
Figure 4
Cryo-EM Analysis of the TspO Helical Crystals (A) An image of negatively stained TspO tubes and small vesicles formed on TspO reconstitution; the scale bar corresponds to 100 nm. (B) Cryo-EM of vitrified TspO tubes on a holey carbon grid. The stacked disk arrangement of the well-preserved tubes is evident from unprocessed images; the scale bar corresponds to 50 nm. (C) Scatter plot of length and width of lipid structures present in the ice-embedded sample. The 25 nm wide tubes constitute two thirds of the sample and vesicles make up the remainder as shown in the pie chart (top inset). The distribution of tube lengths ranged from 100 to 1000 nm (bottom inset). (D) Comparison of an unprocessed cryo-EM image of a tube segment (left) with an average of the aligned image segments of the same azimuthal views (center) and the matched projection from the 3D image reconstruction, which was convoluted by its corresponding CTF (right). The top and bottom row differ in their azimuthal view by a rotation of 16° about the tube axis. (E) Width profiles correspond to the images displayed above (left and center). The pixel rows perpendicular to the tube axis were added to yield an averaged width profile of the tubes, which shows that all included segments contain tubes with a width of 25 nm (left). Averaged projection classes give rise to a less noisy profile (center). (F) Three-dimensional surface presentation of a TspO segment reconstructed at 10 Å resolution.
Figure 5
Figure 5
Grayscale Density Slices of the TspO 3D Reconstruction (A) A slice of density through the helical tube with the inset depicting the orientation of the 4.8 Å thick slices depicted in (B)–(K). (B–G) TspO viewed parallel to the membrane plane; slices of density were made perpendicular to the helical axis of the tube, at various distances from the center of the dimer (D), including −9.6 Å (B), −4.8 Å (C), 4.8 Å (E), 9.6 Å (F), and 14.4 Å (G). (H–K) The TspO dimer viewed perpendicular to the membrane plane; radial slices of density were taken through the membrane plane at positions −7.2 Å (H), −2.4 Å (I), +2.4 Å (J), and +7.2 Å (K) with respect to the center of the bilayer, with + being toward the external surface of the tube. The density interpreted as one molecule of TspO has been circled.
Figure 6
Figure 6
Interpretation of the Experimental Density Map (A) A view perpendicular to the membrane plane of the TpsO dimer with α helices fitted into the density map by eye. Red and blue α helices represent individual monomers of TspO and they are labeled arbitrarily a–e and a′–e′. (B) View parallel to the membrane plane of the TspO dimer and after a 40° rotation to show the highly tilted helices e and e′. (C) View perpendicular to the membrane plane. (D) TspO monomer viewed parallel to the membrane plane, from the perspective of the dimer interface formed by helices a and b and a′ and b′. (E) TspO monomer viewed from the lipid bilayer. The experimental density maps in all the panels was contoured at 1.5 σ.

Similar articles

Cited by

References

    1. Aller S.G., Yu J., Ward A., Weng Y., Chittaboina S., Zhuo R., Harrell P.M., Trinh Y.T., Zhang Q., Urbatsch I.L., Chang G. Structure of P-glycoprotein reveals a molecular basis for poly-specific drug binding. Science. 2009;323:1718–1722. - PMC - PubMed
    1. Anzini M., Cappelli A., Vomero S., Seeber M., Menziani M.C., Langer T., Hagen B., Manzoni C., Bourguignon J.J. Mapping and fitting the peripheral benzodiazepine receptor binding site by carboxamide derivatives. Comparison of different approaches to quantitative ligand-receptor interaction modeling. J. Med. Chem. 2001;44:1134–1150. - PubMed
    1. Bogan R.L., Davis T.L., Niswender G.D. Peripheral-type benzodiazepine receptor (PBR) aggregation and absence of steroidogenic acute regulatory protein (StAR)/PBR association in the mitochondrial membrane as determined by bioluminescence resonance energy transfer (BRET) J. Steroid Biochem. Mol. Biol. 2007;104:61–67. - PubMed
    1. Boujrad N., Gaillard J.L., Garnier M., Papadopoulos V. Acute action of choriogonadotropin on Leydig tumor cells: induction of a higher affinity benzodiazepine-binding site related to steroid biosynthesis. Endocrinology. 1994;135:1576–1583. - PubMed
    1. Boujrad N., Vidic B., Papadopoulos V. Acute action of choriogonadotropin on Leydig tumor cells: changes in the topography of the mitochondrial peripheral-type benzodiazepine receptor. Endocrinology. 1996;137:5727–5730. - PubMed

Publication types

MeSH terms

LinkOut - more resources