. 2010 Jun 15;17(6):547-59.
doi: 10.1016/j.ccr.2010.04.026.

Integrative genomic and proteomic analyses identify targets for Lkb1-deficient metastatic lung tumors

Affiliations

Integrative genomic and proteomic analyses identify targets for Lkb1-deficient metastatic lung tumors

Julian Carretero et al. Cancer Cell. .

Abstract

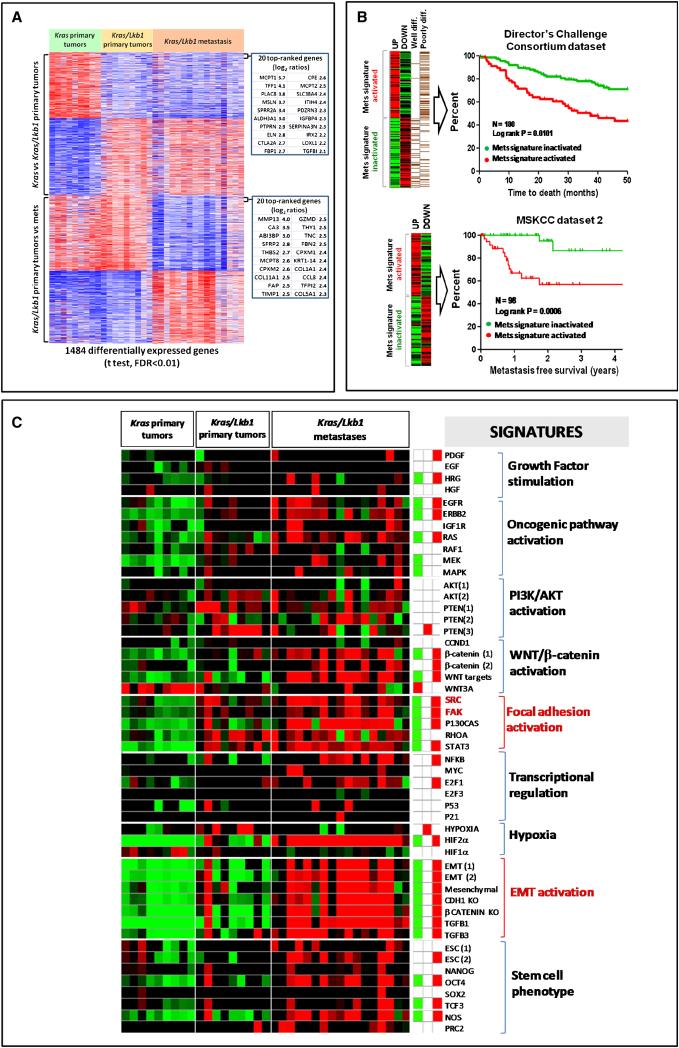
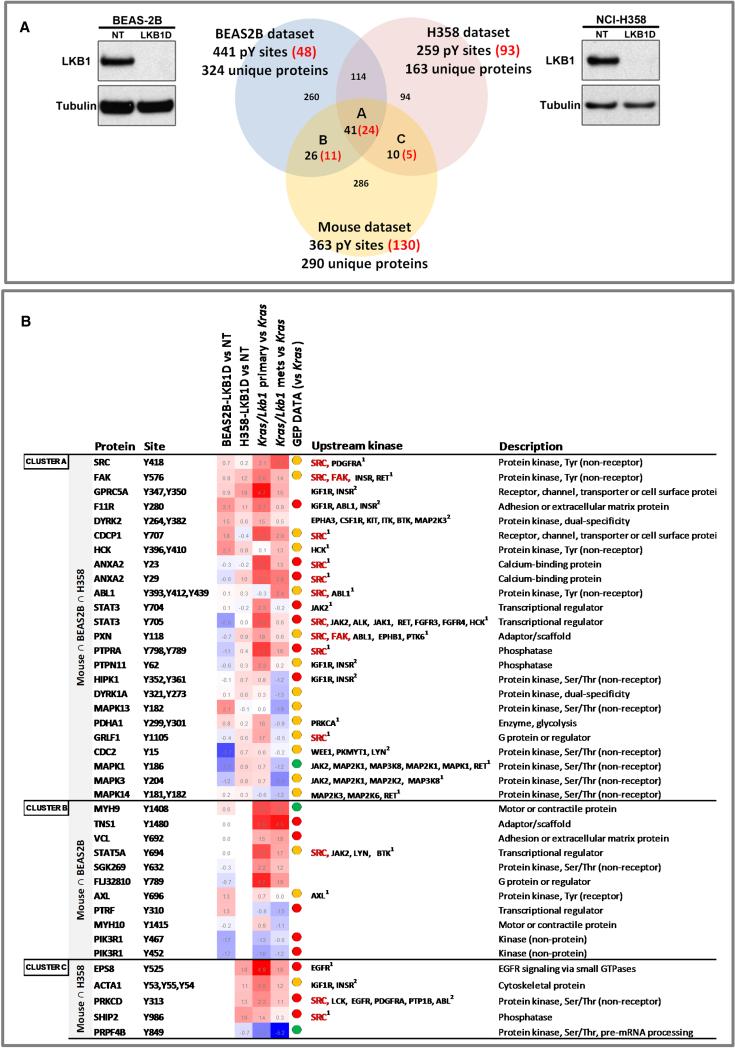
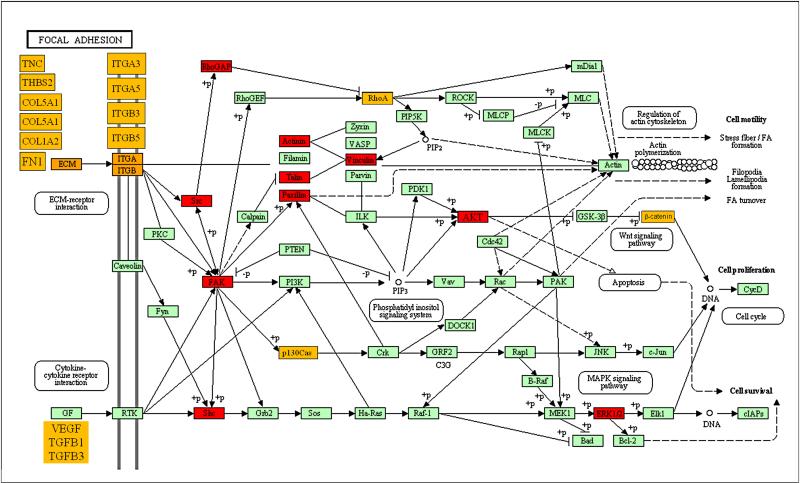
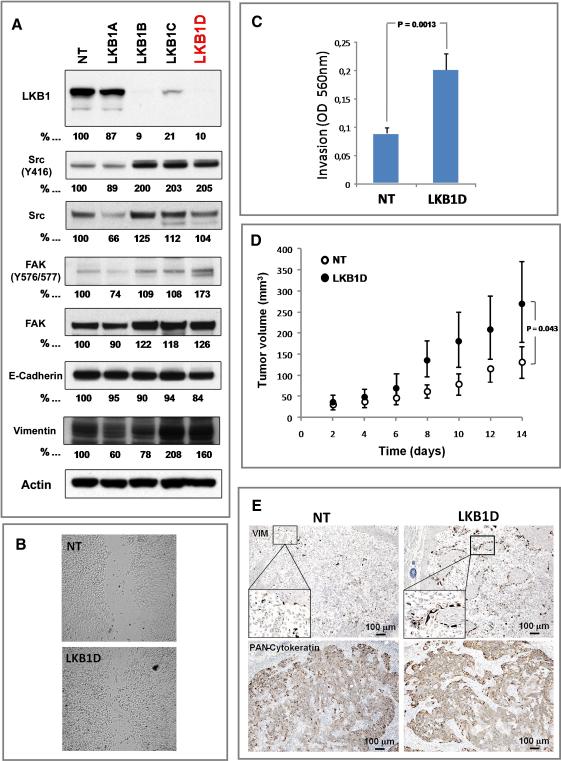
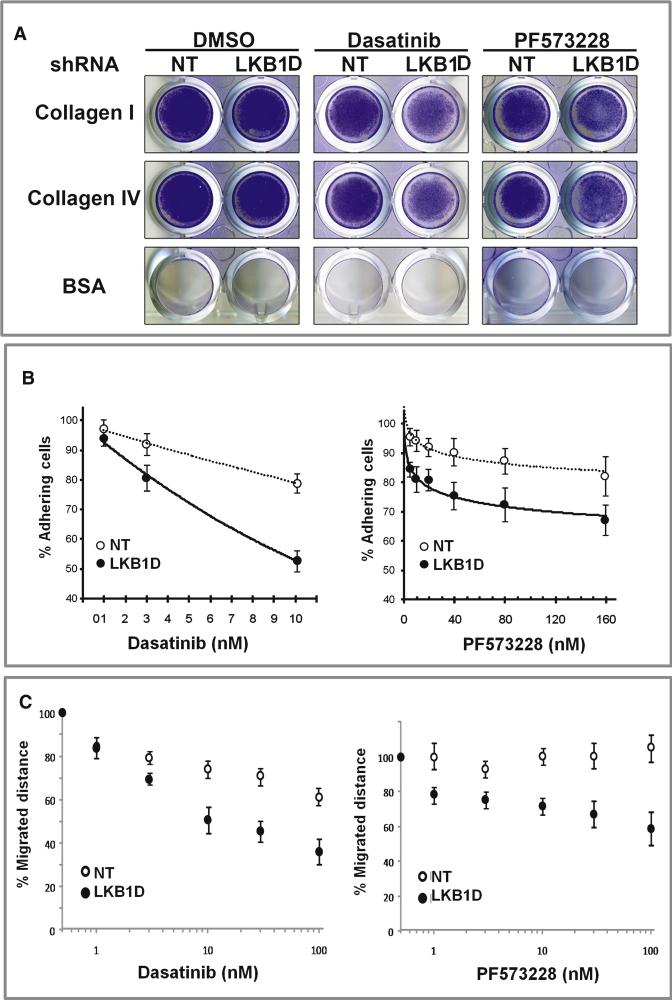
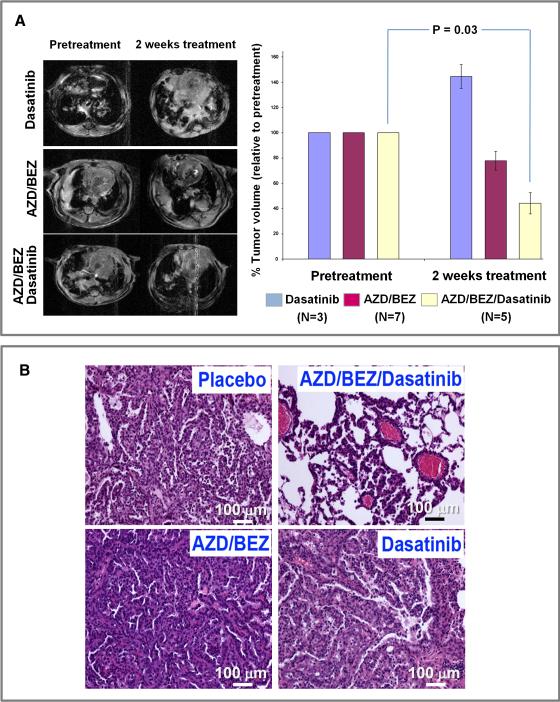
In mice, Lkb1 deletion and activation of Kras(G12D) results in lung tumors with a high penetrance of lymph node and distant metastases. We analyzed these primary and metastatic de novo lung cancers with integrated genomic and proteomic profiles, and have identified gene and phosphoprotein signatures associated with Lkb1 loss and progression to invasive and metastatic lung tumors. These studies revealed that SRC is activated in Lkb1-deficient primary and metastatic lung tumors, and that the combined inhibition of SRC, PI3K, and MEK1/2 resulted in synergistic tumor regression. These studies demonstrate that integrated genomic and proteomic analyses can be used to identify signaling pathways that may be targeted for treatment.


Figures

Figure 1
Figure 1. A gene expression signature of metastasis derived from a Kras-driven, Lkb1-deficient mouse lung cancer model predicts survival in human NSCLC
A. Generation of an expression signature of metastasis. Kras/Lkb1 primary tumors were compared to Kras/Lkb1 metastases using two-class unpaired differential expression analysis and a false discovery rate (FDR) of <0.01. A total of 757 unique transcripts were significantly differentially deregulated and used to define a metastatic gene signature (Mets). B. Kaplan-Meier analysis of the Director's Challenge Consortium dataset (N=180) and Memorial Sloan Kettering Cancer Center dataset 2 (N=98) of human lung tumors comparing the overall survival between tumors showing activation (red line) or inactivation (green line) of our mouse derived Mets signature. Red line = Mets signature activated. Green line = Mets signature inactivated. C. Heat map of relative enrichment scores derived by gene set enrichment analysis. Tumors are represented in columns and genes signatures are represented in rows (red = significant enrichment of overexpressed genes; green, significant enrichment of under-expressed genes; black, not significant; p<0.05). The right panel shows the aggregate enrichment scores for each of the three classes of tumors (Kras, Kras/Lkb1 primary tumors and Kras/Lkb1 metastases). See also Table S1 and Figure S1.
Figure 2
Figure 2. Phosphoprotein profiling of human cell lines and murine tumors
A. Venn diagram of phosphotyrosine sites identified in Kras/Lkb1 primary versus metastatic murine tumors and isogenic paired cell lines (NCI-H358 and BEAS-2B) expressing shRNA to LKB1 (LKB1D) or a non-targeting shRNA (NT). Western blots show the effectiveness of LKB1 knockdown (LKB1D) in NCI-H358 and BEAS-2B cells. Red numbers in brackets show differentially increased or decreased phosphotyrosine sites in each comparison. B. Table of coordinately regulated, LKB1 dependent, phosphotyrosine sites. Details of the LKB1 dependent phosphotyrosine sites found to be coordinately regulated across datasets are listed and include the phosphorylated protein, the tyrosine site, heatmaps of log2 ratios of indicated comparisons (red, positive log2 ratios; blue, negative log2 ratios), as well as the putative upstream kinase. The GEP (gene expression profiling) data column indicates the level of expression of the genes encoding these proteins between Kras/Lkb1 (primary or mets) versus Kras murine tumors comparisons (red dots = significantly overexpressed, green dots = significantly underexpressed, and orange dots = no significant change). 1 Upstream kinases obtained from PhosphoELM, HPRD and Swissprot databases; 2 Upstream kinases obtained from NetworKIN database. See also Figure S2.
Figure 3
Figure 3. Focal adhesion is impaired in Kras/Lkb1 tumors and metastases
Most relevant findings from our genomic and proteomic analysis were depicted on the focal adhesion KEGG pathway. Proteins labeled in red were hyperphosphorylated in the Phosphoscan analysis comparing Kras/Lkb1 primary tumors and metastases within the Phosphoscan analysis comparing Kras/Lkb1 primary tumors and metastases with Kras alone tumors. (Figure 2B). Proteins labeled in marked orange were found overexpressed (or their signatures were enriched) in the gene expression profiling comparing Kras/Lkb1 primary tumors and metastases with Kras alone tumors (Figures 1A and 1C).
Figure 4
Figure 4. LKB1 knockdown activates EMT markers, mediators of focal adhesion dynamics and enhances cell motility
A. Western blot analysis of NCI-H358 cells (LKB1 wild-type, KRAS G12C mutant) infected with lentiviruses encoding 4 different sequences of shRNAs (A-D) targeting LKB1 or non-targeting shRNA (NT). Whole cell lysates were imunoblotted with antibodies specific to LKB1 or tyrosine specific antibodies against SRC (Total and Y416), FAK (Total and Y576), paxillin (Total and Y118), E-Cadherin, and vimentin. α/β-actin (Actin) serves as a loading control. B. Representative photographs of scratched areas of confluent monolayers of NCIH358 cells expressing a shRNA to LKB1 (LKB1D) or a non-targeting shRNA (NT) 12 hours after wounding with a pipet tip. C. NCI-H358 cells expressing shRNA to LKB1 (LKB1D) or non-targeting shRNA (NT) were subjected to invasion assay in Boyden chambers coated with matrigel for 48 hours using 10% FBS as chemoattractant. Data is graphed as mean of 3 replicates ± SD. D. Mean tumor volume measurements of NCI-H358 xenografts. The human lung cancer cells, NCI-H358, expressing shRNA to LKB1 (LKB1D) or a non-targeting shRNA (NT) were grown subcutaneously in athymic nude mice. After 14 days the tumors were measured and the tumor volume calculated (error bars = 1 SD; n=5, p=0.043). E. Immunohistochemical staining of human vimentin and human cytokeratins in NCIH358 NT and LKB1D xenografts. See also Figure S3.
Figure 5
Figure 5. LKB1 knockdown cooperates with FAK and SRC inhibition to prevent adhesion to Collagen and migration in NCI-H358 cells
A. Exponentially growing NCI-H358 cells expressing shRNA to LKB1 or a nonspecific shRNA (NT) were seeded at 5×10⁵ cells in wells coated with collagen I, collagen IV, or BSA and allowed to adhere to the matrices in the presence of DMSO (control), 10nM Dasatinib (SRC inhibitor) or 100nM PF 573228 (FAK inhibitor) . After 90 minutes, loose cells were washed off and adherent cells were fixed and stained. B. NCI-H358 cells expressing shRNA to LKB1 (LKB1D) or a non-specific shRNA (NT) were seeded at 1×10⁵ cells/well onto collagen I coated 96 well plates containing DMSO or increasing concentrations of Dasatinib or PF573228, and incubated for 90 minutes. Data points represent the average of normalized values expressed as % of adhesion compared to DMSO-treated cells, from two independent experiments performed in triplicate; error bars = SD. C. NCI-H358 cells expressing shRNA to LKB1 (LKB1D) or a non-specific shRNA (NT) were seeded at 1×10⁵ cells/well onto 24well and cells were allowed to grow until forming confluent monolayers. The monolayer was scratched with a pipet tip to form a wound and the cells were grown in media containing DMSO or increasing concentrations of Dasatinib or PF573228. 12 hours after wounding of the confluent monolayers, the wound closure was measured and expressed as % closure of the original wound. Data is graphed as mean of 3 replicates ± SD.
Figure 6
Figure 6. Combination therapy with PI3K, MEK, and SRC inhibitors results in synergistic in vivo response of Lkb1 deficient murine lung tumors
A. Representative MRI images before and after treatment for each group. Mice in each group were MRI imaged then treated daily for two weeks with the following doses: 45 mg/kg of BEZ235, 25mg/kg of AZD6244 and 15 mg/kg of Dasatinib and imaged again. Tumor volumes were normalized to pretreatment tumor volumes. The average tumor volumes of 3-7 mice in each treatment group are shown. Error bars = 1 SD (p < 0.05 BEZ/AZD/Dasatinib-treated versus pretreatment). B. H&E staining. H&E sections of representative Kras/Lkb1 tumors from animals treated with the indicated drugs. See also Tables S2 and S3.

Comment in

Similar articles

Cited by

References

    1. Al-Shahrour F, Diaz-Uriarte R, Dopazo J. FatiGO: a web tool for finding significant associations of Gene Ontology terms with groups of genes. Bioinformatics. 2004;20:578–580. - PubMed
    1. Alessi DR, Sakamoto K, Bayascas JR. LKB1-dependent signaling pathways. Annu Rev Biochem. 2006;75:137–163. - PubMed
    1. Arthur WT, Petch LA, Burridge K. Integrin engagement suppresses RhoA activity via a c-Src-dependent mechanism. Curr Biol. 2000;10:719–722. - PubMed
    1. Ben-Porath I, Thomson MW, Carey VJ, Ge R, Bell GW, Regev A, Weinberg RA. An embryonic stem cell-like gene expression signature in poorly differentiated aggressive human tumors. Nature genetics. 2008;40:499–507. - PMC - PubMed
    1. Bild AH, Yao G, Chang JT, Wang Q, Potti A, Chasse D, Joshi MB, Harpole D, Lancaster JM, Berchuck A, et al. Oncogenic pathway signatures in human cancers as a guide to targeted therapies. Nature. 2006;439:353–357. - PubMed

Publication types

MeSH terms

Substances

Associated data