. 2010 Jun 25;32(6):766-77.
doi: 10.1016/j.immuni.2010.05.011. Epub 2010 Jun 11.

Constitutively active Lck kinase in T cells drives antigen receptor signal transduction

Affiliations

Constitutively active Lck kinase in T cells drives antigen receptor signal transduction

Konstantina Nika et al. Immunity. .

Abstract

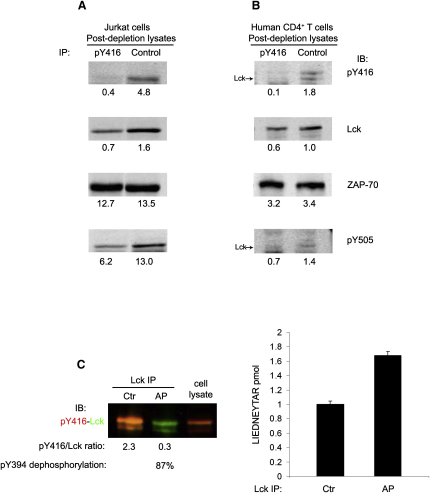
T cell antigen receptor (TCR) and coreceptor ligation is thought to initiate signal transduction by inducing activation of the kinase Lck. Here we showed that catalytically active Lck was present in unstimulated naive T cells and thymocytes and was readily detectable in these cells in lymphoid organs. In naive T cells up to approximately 40% of total Lck was constitutively activated, part of which was also phosphorylated on the C-terminal inhibitory site. Formation of activated Lck was independent of TCR and coreceptors but required Lck catalytic activity and its maintenance relied on monitoring by the HSP90-CDC37 chaperone complex to avoid degradation. The amount of activated Lck did not change after TCR and coreceptor engagement; however it determined the extent of TCR-zeta phosphorylation. Our findings suggest a dynamic regulation of Lck activity that can be promptly utilized to initiate T cell activation and have implications for signaling by other immune receptors.


Figures

Figure 1
Figure 1
Activated SFKs in T Cells and Thymocytes (A) Dual fluorescence immunoblot (IB) for Lck (green) and pY416 (red) in Jurkat cells, TCR-, CD4-, and CD8-deficient 31.13 (TCR-) and TCR-reconstituted 31.13 (TCR+) Jurkat cells, human and mouse CD4+ and CD8+ T cells, and mouse thymocytes from normal and Rag1−/− mice. Merged (yellow) denotes expression of pY394-Lck (see Figure S1C). The ∼59 kDa species is mostly pY418-Fyn. (B) Confocal IF of human CD4+ T cells stained for CD4 and either for Lck or active SFKs (pY416). Nuclei were counterstained with Hoechst 33258 (blue). The scale bar represents 3.5 μm. (C) Confocal IF for Lck forms in human CD4+ T cells. Double staining with two different Abs to Lck, a rabbit Ab (red) and a mouse mAb (green) (first row), was used as the positive control for colocalization. Double staining with a rabbit Ab to Lck (green) and a mAb to Filamin A (red) (bottom row) was the negative control (lack of colocalization). The presence of pY394-Lck was identified by double staining with Lck mAb (green) and pY416 rabbit Ab (red) (second row). For pY394 and pY505 colocalization (third row), we used anti-pY416 rabbit Ab (green) and anti-pY505 mAb (red). The degree of colocalization was determined with Imaris colocalization software. Corresponding pictures were merged (third column) and all pixels colocalized were represented as white spots (fourth column). Each colocalized pixel was plotted on a scatter diagram for producing correlation plots with colocalizing pixels falling around the diagonal line (right-hand column). Data from at least 50 cells for each condition were used for calculating the Pearson's correlation coefficient (Rr) as mean ± SE p values (two-tailed) determined with Student's t test. The scale bar represents 3.5 μm. (D) Confocal IF images of a mouse spleen, LN, and thymus. Tissue sections (10 μm) were stained with biotin-labeled anti-mouse CD4 (L3T4) (red) and anti-pY416 (rabbit) (green). The scale bar represents 10 μm. Images are representative of three independent experiments.
Figure 2
Figure 2
Quantification of pY394-Lck and pY505-Lck in T Cells (A and B) Denatured lysates from (A) Jurkat cells or (B) human CD4+ T cells were split into two halves and subjected to three rounds of immunoprecipitations (IP) with pY416 Ab (pY416) or rabbit IgG (Control), respectively. Lysates were analyzed by immunoblotting (IB) for residual pY394-Lck, Lck, and pY505-Lck. The loading control was ZAP-70. IBs were scanned for fluorescence and relevant bands were quantified. Numbers below each panel correspond to the actual fluorescence signals. (C) Lck isolated from Jurkat cells with the 3A5 mAb was split in two and incubated with (AP) or without (Ctr) alkaline phosphatase for 30 min at 37°C. The fraction of pY394 dephosphorylated was determined by immunoblotting (left panel). Lck from 107 cells (twice for each condition) was in-gel digested with trypsin, after spiking with 1 pmol of [L-C13N15] IEDNEYTAR. Each sample was analyzed twice by MS. Histogram represents mean picomoles ± SE, n = 4 of endogenous LIEDNEYTAR in AP-treated and untreated samples. Details of AQUA and MS are available in the Supplemental Information.
Figure 3
Figure 3
A Proportion of Lck Is Phosphorylated at Both Y394 and Y505 (A and B) Denatured lysates from (A) Jurkat cells or (B) human CD4+ T cells were treated as in Figures 2A and 2B but immunoprecipitated with anti-pY505 rabbit Ab (pY505) or rabbit IgG (Control). Postdepletion lysates were probed for residual pY505-Lck, Lck, and pY394-Lck. The loading control was ZAP-70. Signal intensity was detected as in Figures 2A and 2B. (C) Denatured lysates of human CD4+ T cells (left panels) or total mouse thymocytes (right panels) were immunoprecipitated with anti-pY505 or anti-pY416 or rabbit IgG (Control) and immunoblotted with anti-pY416 (red) or anti-pY505 (red), respectively, and with anti-Lck (green). Merged images (yellow) reveal pY394-Lck containing pY505 and vice versa. (D) Native or denatured Jurkat lysates were immunoprecipitated three times with anti-pY505 or rabbit IgG. Immunoprecipitates were pooled, immunoblotted for pY505, Lck, and pY394-Lck (with anti-pY416), and quantified. These experiments were performed three times with similar results.
Figure 4
Figure 4
Catalytic Activity of Dpho-Lck (A) Lck activity is mostly associated with pY394-Lck. Jurkat lysates were immunoprecipitated with anti-pY416 or anti-Y416 or with control IgG (Control) and subjected to in vitro kinase assay on rCD3-ζ-GST. The reaction mixture was immunoblotted for pY142-ζ, GST, pY394 (pY416), and Lck and quantified by near-infrared fluorescence (numbers below each panel). Overlapping Lck and pY416 fluorescence (not shown) provide positive identification of pY394-Lck. Kinase activity (right panel) was expressed as pY142-ζ signal subtracted for IgG control and normalized for rCD3-ζ-GST. (B and C) Dpho- and pY394/Y505-Lck have similar kinase activity. As shown in (B), DPho (pY394-pY505) and pY394 (pY394-Y505) were individually enriched by immunoprecipitation (see Results). An aliquot was subjected to dual fluorescence immunoblotting with anti-pY416 (red) and anti-Y416 (green) or anti-pY505 (red) and anti-Lck (green). The control was rabbit IgG. In (C), Dpho- and pY394-Lck from (B) and IgG control immunoprecipitations were assayed for kinase activity on rCD3-ζ-GST as in (A) and immunoblotted for pY142-ζ, GST and pY394 (pY416). Identification of pY394-Lck was as in (A). A representative experiment of three giving similar results is shown.
Figure 5
Figure 5
Basal Amounts of Active Lck Are Regulated by Its Own Kinase Activity and Binding to the HsP90-CDC37 Chaperone Complex (A) Jurkat cells were treated with different concentrations of PP2 or its inactive analog PP3. The amount of pY394-Lck was quantitated by anti-pY416 immunoblotting at the indicated times. Error bars represent standard deviation from three independent experiments. (B) Jurkat cells were treated with 5 μM Geldanamycin, or DMSO as control, for 3 hr at 37°C. Cell lysates were probed with anti-pY416 and anti-Lck, and GAPDH was used as a loading control. The histogram on the right represents data collected from three independent experiments. (C) Jurkat cells preincubated with 50 μM PP2 or its inactive analog PP3, or J45 cells, were treated with 5 μM Geldanamycin or DMSO, as in (B). The amount of Lck was determined by anti-Lck immunoblotting and protein loading by GAPDH (not shown). Error bars represent standard deviation from three independent experiments
Figure 6
Figure 6
TCR Ligation Does Not Increase pY394-Lck or Lck Kinase Activity (A) Jurkat cells stimulated for the indicated times with anti-CD3. An aliquot was probed with anti-pY, anti-pY142-ζ, and anti-pY416. Lck (bottom panel) was a loading control. (B) Human CD4+ T cells were added for the indicated times to unpulsed or sAg-pulsed Raji B cells. Cell activation was detected by pYLAT and pY142-ζ as in (A). Lysates were also probed for pY394-Lck (with anti-pY416) and Lck. The ∼59 kDa species is mostly Fyn. (C) 2D1 TCR-tg CD8+ T cells were stimulated with either unpulsed or PLP peptide-pulsed LPS-activated B cells from MHC class I HLA-A3 tg mice. Cell activation and pY394-Lck changes were monitored as in (B). (D) 2D1 TCR-tg CD8+ T cells were stimulated for the indicated times with A3-PLP-MHC class-I tetramers. Cell activation and pY394 changes were detected as in (C). Each of these experiments was performed at least twice. (E) Confocal IF of purified human CD4+ T cells left untreated or stimulated with anti-CD3 for 2 min at 37°C. Cells were fixed, mixed at a ratio 1:1, and stained with anti-pY416 (top panels) or anti-pY505 (bottom panels), revealed by anti-rabbit Alexa594 (red), and with anti-mouse Alexa488 (green) to detect the presence of anti-CD3. The histograms represent the average anti-pY416 or anti-pY505 fluorescence intensity measurements, in 15 cells, from single-focal planes chosen at random ± SE (13.26 ± 1.4 and 13.59 ± 1.7 n = 15 ROI. p < 0.05) in unstimulated (CD3) and stimulated (CD3+) cells respectively. The dot plots on the right represent the distribution of fluorescence intensity/cell for the same set of cells. The scale bar represents 5 μm. (F) Jurkat cells treated for 3 hr with 5 μM Geldanamycin, or DMSO as control, were stimulated for the indicated times with anti-CD3. Cell lysates were probed with anti-pY142-ζ and the intensity of the bands was quantitated by near-infrared fluorescence. Anti-pY142-ζ values, normalized for protein loading (by GAPDH immunoblotting), were plotted against stimulation time so that induction of ζ chain phosphorylation could be designated. The histogram shows the reduction on pY394 and total Lck resulting from geldanamycin treatment. One representative experiment out of three is shown.

References

    1. Acuto O., Di Bartolo V., Michel F. Tailoring T-cell receptor signals by proximal negative feedback mechanisms. Nat. Rev. Immunol. 2008;8:699–712. - PubMed
    1. Au-Yeung B.B., Deindl S., Hsu L.Y., Palacios E.H., Levin S.E., Kuriyan J., Weiss A. The structure, regulation, and function of ZAP-70. Immunol. Rev. 2009;228:41–57. - PubMed
    1. Baker B.M., Wiley D.C. alpha beta T cell receptor ligand-specific oligomerization revisited. Immunity. 2001;14:681–692. - PubMed
    1. Beddoe T., Chen Z., Clements C.S., Ely L.K., Bushell S.R., Vivian J.P., Kjer-Nielsen L., Pang S.S., Dunstone M.A., Liu Y.C. Antigen ligation triggers a conformational change within the constant domain of the alphabeta T cell receptor. Immunity. 2009;30:777–788. - PubMed
    1. Boggon T.J., Eck M.J. Structure and regulation of Src family kinases. Oncogene. 2004;23:7918–7927. - PubMed

Publication types

MeSH terms

Substances