

Systematic analysis of essential genes reveals important regulators of G protein signaling
- PMID: 20542006
- PMCID: PMC2919228
- DOI: 10.1016/j.molcel.2010.05.026
Systematic analysis of essential genes reveals important regulators of G protein signaling
Abstract
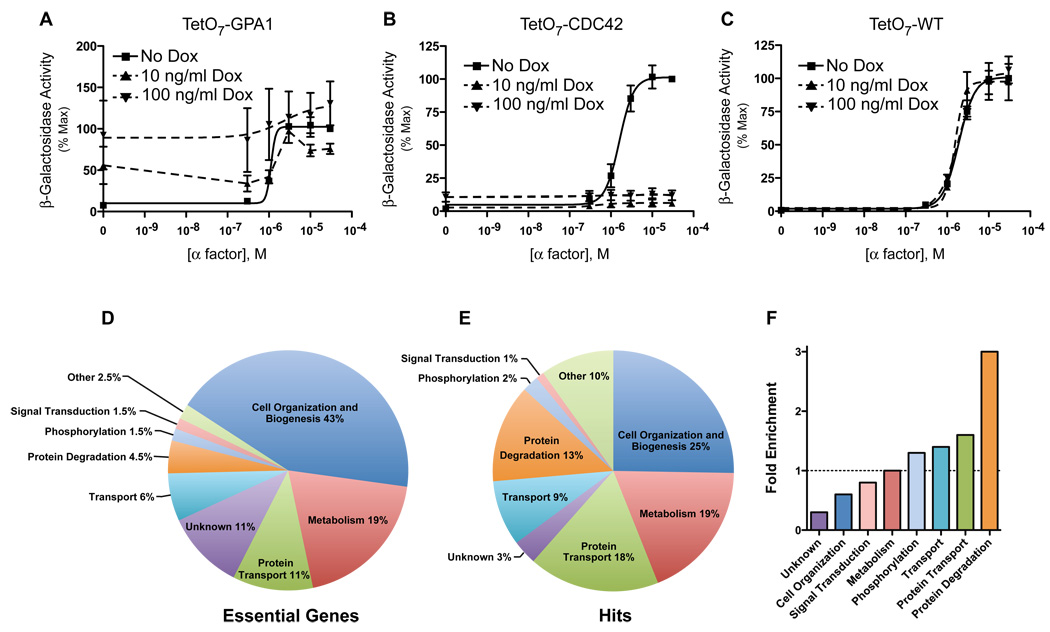
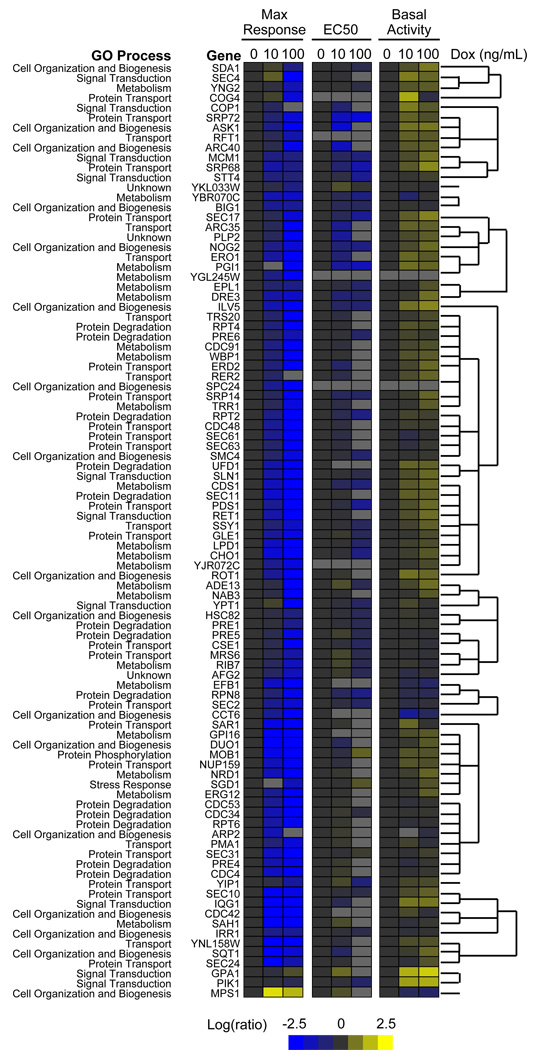
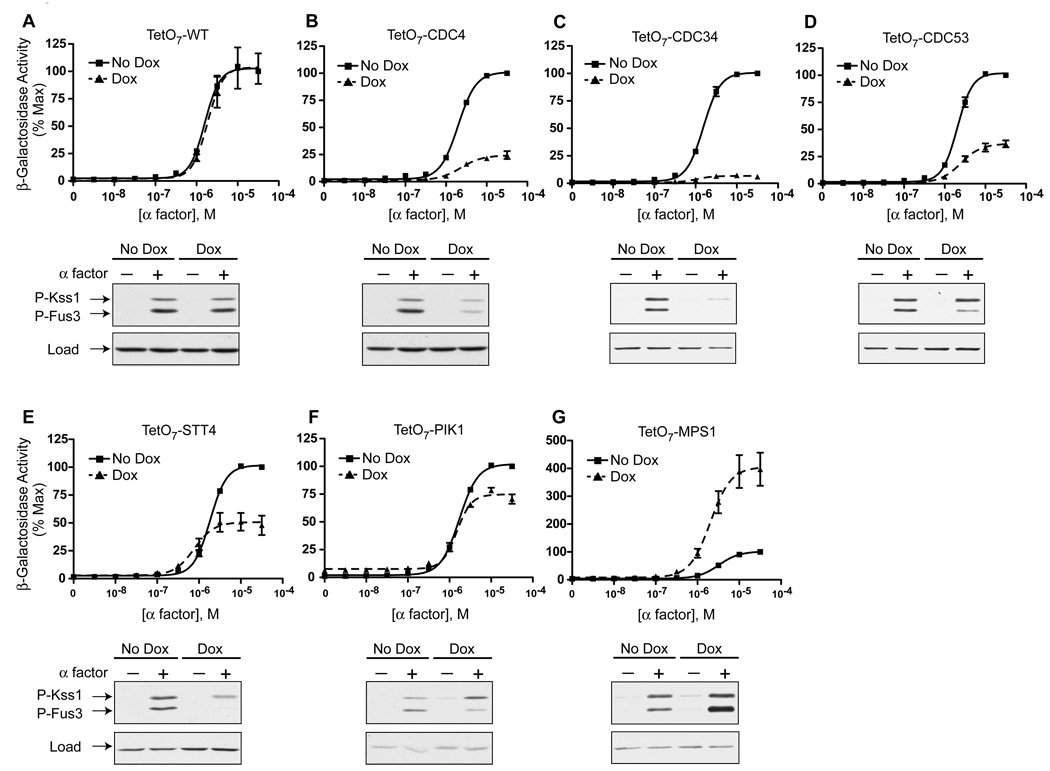
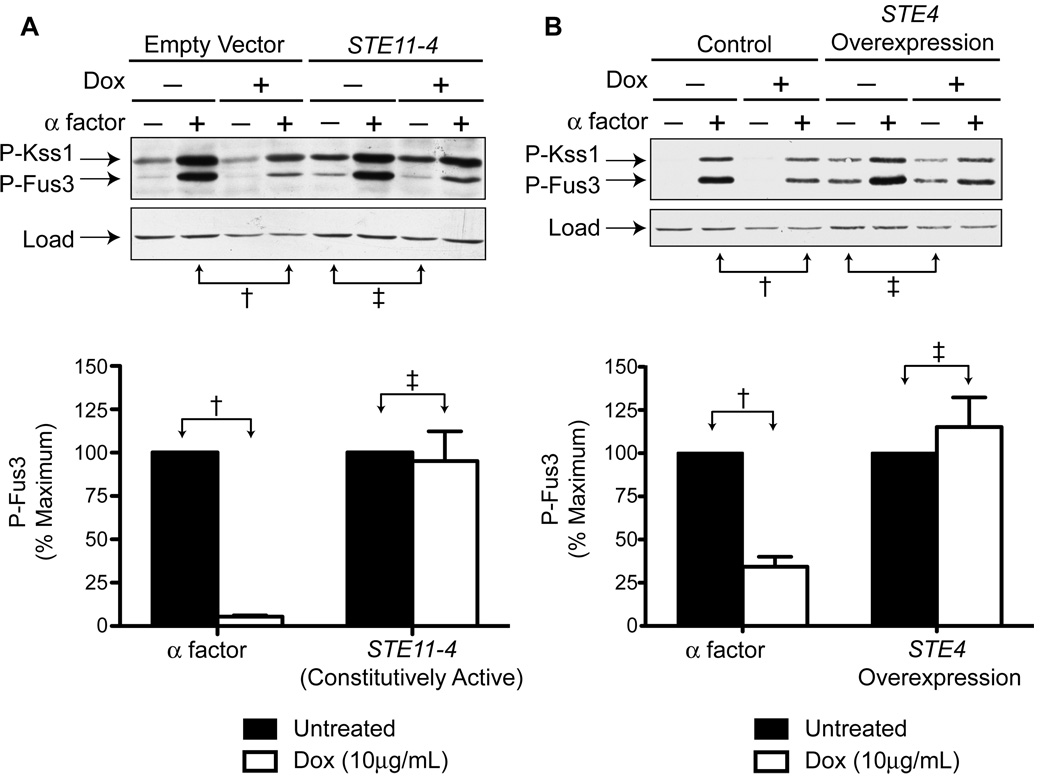
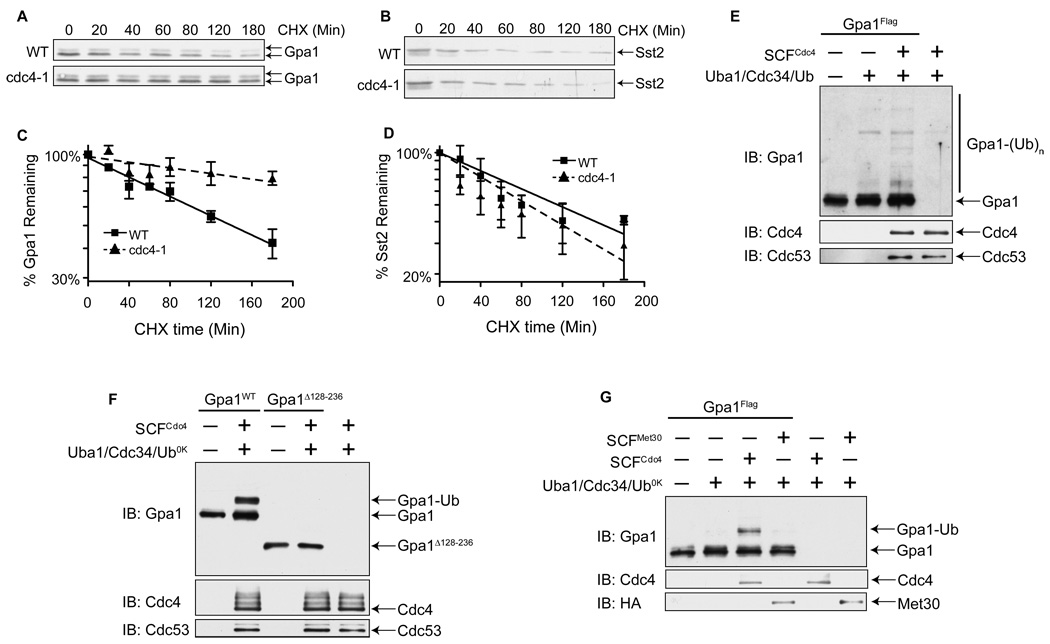
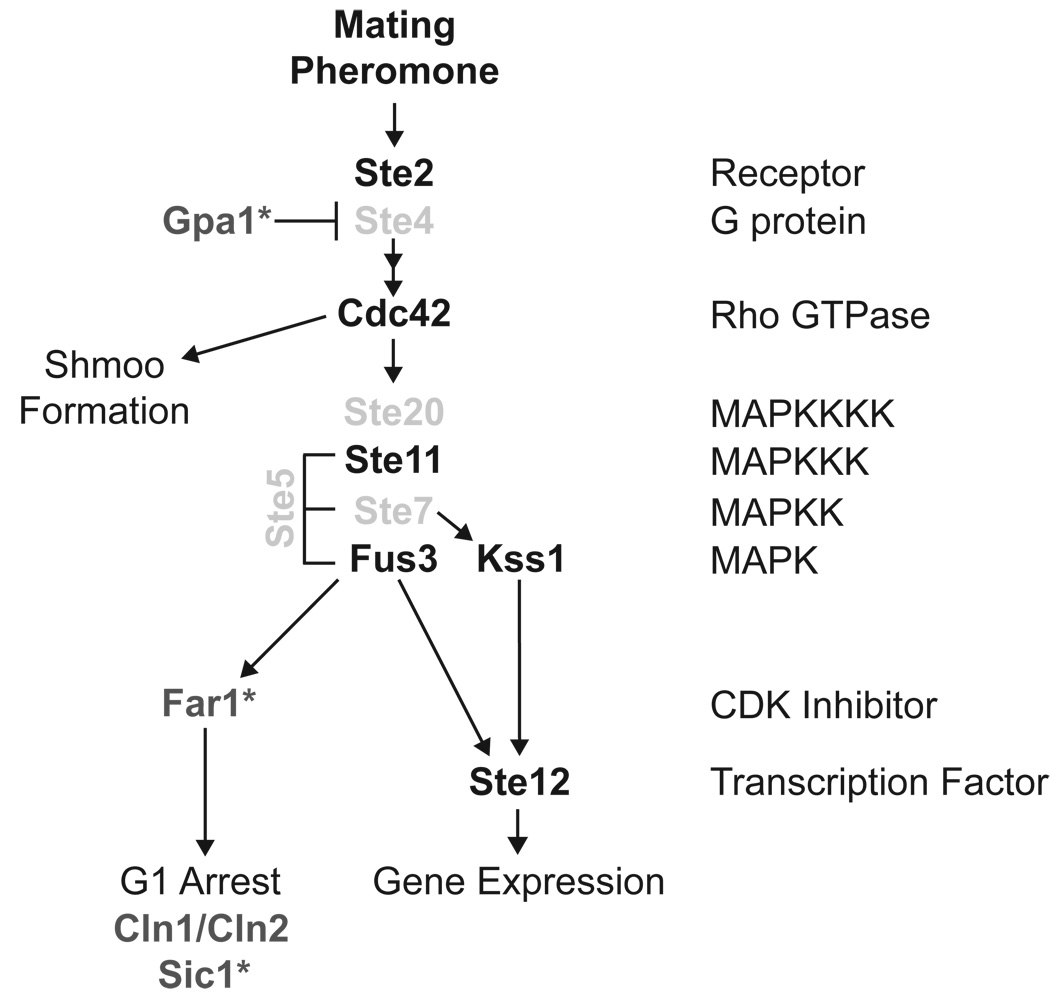
The yeast pheromone pathway consists of a canonical heterotrimeric G protein and MAP kinase cascade. To identify additional signaling components, we systematically evaluated 870 essential genes using a library of repressible-promoter strains. Quantitative transcription-reporter and MAPK activity assays were used to identify strains that exhibit altered pheromone sensitivity. Of the 92 newly identified essential genes required for proper G protein signaling, those involved with protein degradation were most highly represented. Included in this group are members of the Skp, Cullin, F box (SCF) ubiquitin ligase complex. Further genetic and biochemical analysis reveals that SCF(Cdc4) acts together with the Cdc34 ubiquitin-conjugating enzyme at the level of the G protein; promotes degradation of the G protein alpha subunit, Gpa1, in vivo; and catalyzes Gpa1 ubiquitination in vitro. These insights to the G protein signaling network reveal the essential genome as an untapped resource for identifying new components and regulators of signal transduction pathways.
Copyright (c) 2010 Elsevier Inc. All rights reserved.
Figures
Similar articles
-
Multisite phosphorylation of the Saccharomyces cerevisiae filamentous growth regulator Tec1 is required for its recognition by the E3 ubiquitin ligase adaptor Cdc4 and its subsequent destruction in vivo.Eukaryot Cell. 2010 Jan;9(1):31-6. doi: 10.1128/EC.00250-09. Epub 2009 Nov 6. Eukaryot Cell. 2010. PMID: 19897738 Free PMC article.
-
Pheromone-dependent destruction of the Tec1 transcription factor is required for MAP kinase signaling specificity in yeast.Cell. 2004 Dec 29;119(7):991-1000. doi: 10.1016/j.cell.2004.11.052. Cell. 2004. PMID: 15620357
-
The Cdc34/SCF ubiquitination complex mediates Saccharomyces cerevisiae cell wall integrity.Genetics. 2006 Dec;174(4):1825-39. doi: 10.1534/genetics.106.059154. Epub 2006 Oct 8. Genetics. 2006. PMID: 17028344 Free PMC article.
-
[Relationship of ubiquitin-ligases APC/C and SCF complex to cancer].Beijing Da Xue Xue Bao Yi Xue Ban. 2010 Apr 18;42(2):243-5. Beijing Da Xue Xue Bao Yi Xue Ban. 2010. PMID: 20396374 Review. Chinese.
-
Regulation of the cell cycle by SCF-type ubiquitin ligases.Semin Cell Dev Biol. 2005 Jun;16(3):323-33. doi: 10.1016/j.semcdb.2005.02.010. Semin Cell Dev Biol. 2005. PMID: 15840441 Review.
Cited by
-
Pleiotropic effects of deubiquitinating enzyme Ubp5 on growth and pathogenesis of Cryptococcus neoformans.PLoS One. 2012;7(6):e38326. doi: 10.1371/journal.pone.0038326. Epub 2012 Jun 14. PLoS One. 2012. PMID: 22719877 Free PMC article.
-
Systematic Identification of Essential Genes Required for Yeast Cell Wall Integrity: Involvement of the RSC Remodelling Complex.J Fungi (Basel). 2022 Jul 8;8(7):718. doi: 10.3390/jof8070718. J Fungi (Basel). 2022. PMID: 35887473 Free PMC article.
-
Selective regulation of MAP kinase signaling by an endomembrane phosphatidylinositol 4-kinase.J Biol Chem. 2011 Apr 29;286(17):14852-60. doi: 10.1074/jbc.M110.195073. Epub 2011 Mar 9. J Biol Chem. 2011. PMID: 21388955 Free PMC article.
-
Guanine nucleotide-binding protein (Gα) endocytosis by a cascade of ubiquitin binding domain proteins is required for sustained morphogenesis and proper mating in yeast.J Biol Chem. 2014 May 23;289(21):15052-63. doi: 10.1074/jbc.M114.566117. Epub 2014 Apr 10. J Biol Chem. 2014. PMID: 24722989 Free PMC article.
-
Why are essential genes essential? - The essentiality of Saccharomyces genes.Microb Cell. 2015 Jul 25;2(8):280-287. doi: 10.15698/mic2015.08.218. Microb Cell. 2015. PMID: 28357303 Free PMC article. Review.
References
-
- Ardley HC, Robinson PA. E3 ubiquitin ligases. Essays Biochem. 2005;41:15–30. - PubMed
-
- Audhya A, Emr SD. Stt4 PI 4-kinase localizes to the plasma membrane and functions in the Pkc1-mediated MAP kinase cascade. Dev Cell. 2002;2:593–605. - PubMed
-
- Barral Y, Jentsch S, Mann C. G1 cyclin turnover and nutrient uptake are controlled by a common pathway in yeast. Genes Dev. 1995;9:399–409. - PubMed
-
- Breitkreutz BJ, Stark C, Tyers M. Osprey: a network visualization system. Genome Biol. 2002;2 PREPRINT0012. - PubMed
Publication types
MeSH terms
Substances
Grants and funding
LinkOut - more resources
Full Text Sources
Other Literature Sources
Molecular Biology Databases
Research Materials
