Review
. 2010 Nov 30;174(1-2):4-28.
doi: 10.1016/j.resp.2010.06.001. Epub 2010 Jun 11.

An integrative model of respiratory and cardiovascular control in sleep-disordered breathing

Affiliations
Review

An integrative model of respiratory and cardiovascular control in sleep-disordered breathing

Limei Cheng et al. Respir Physiol Neurobiol. .

Abstract

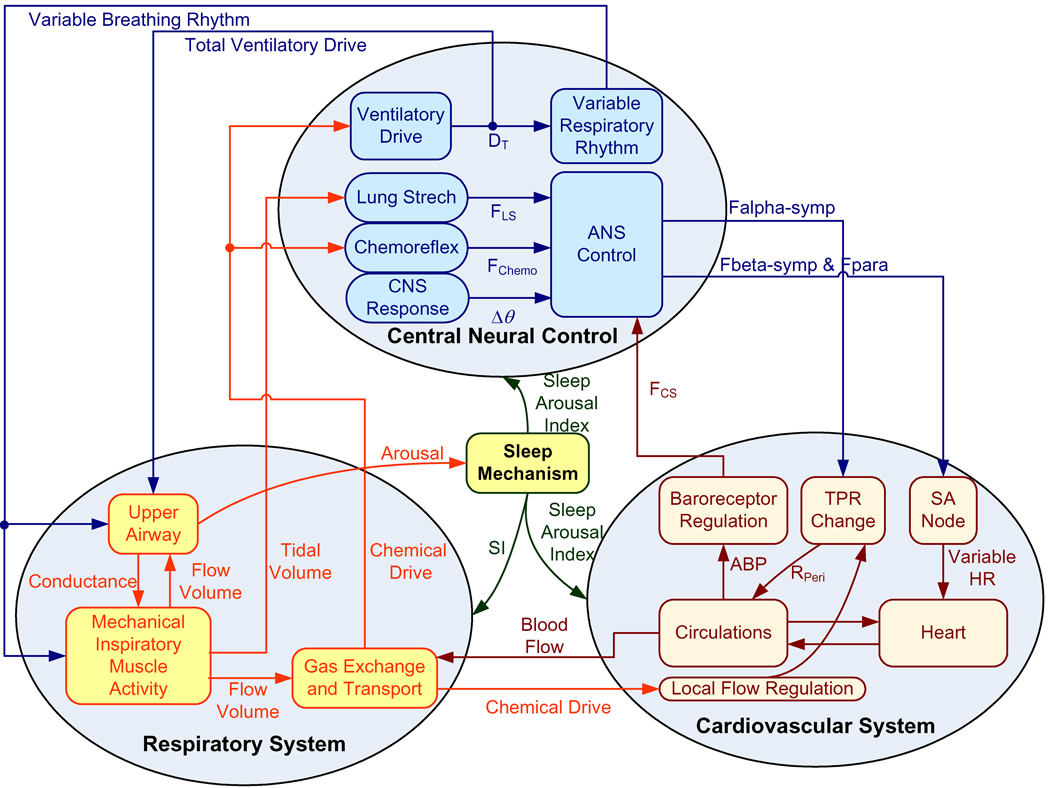
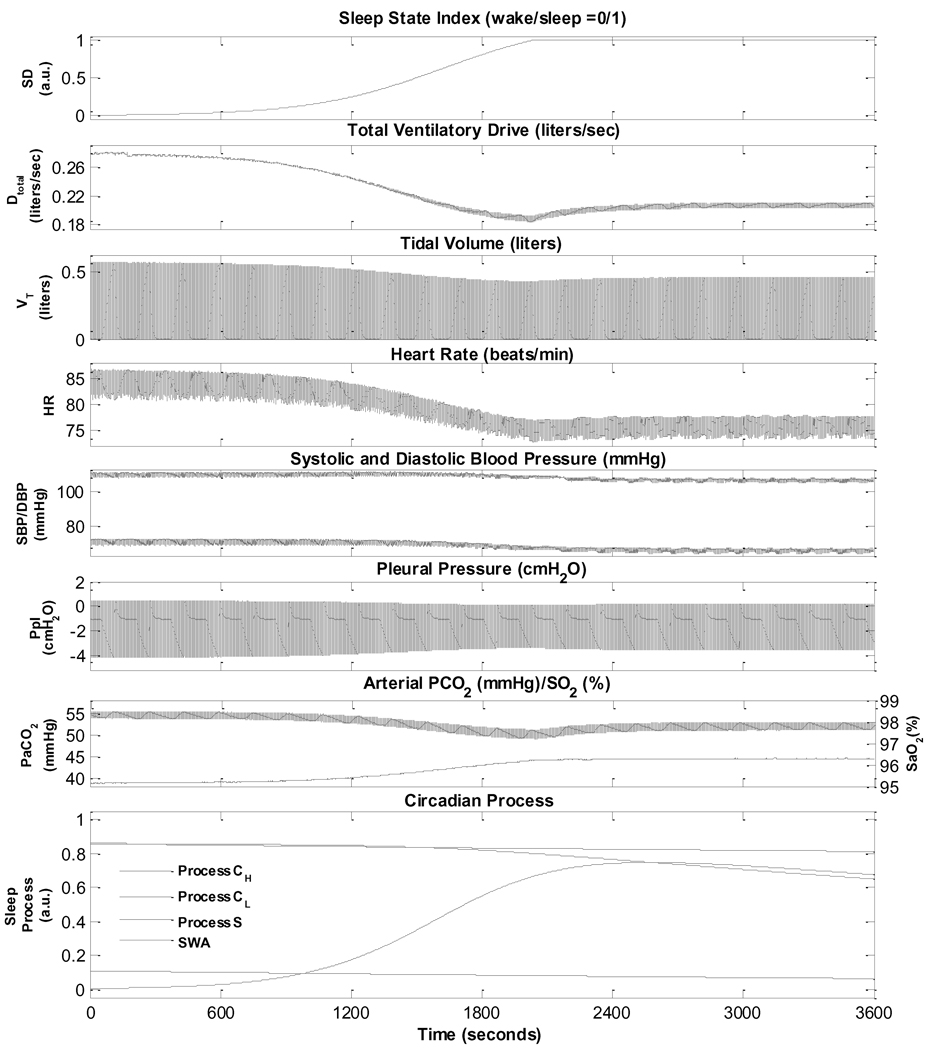
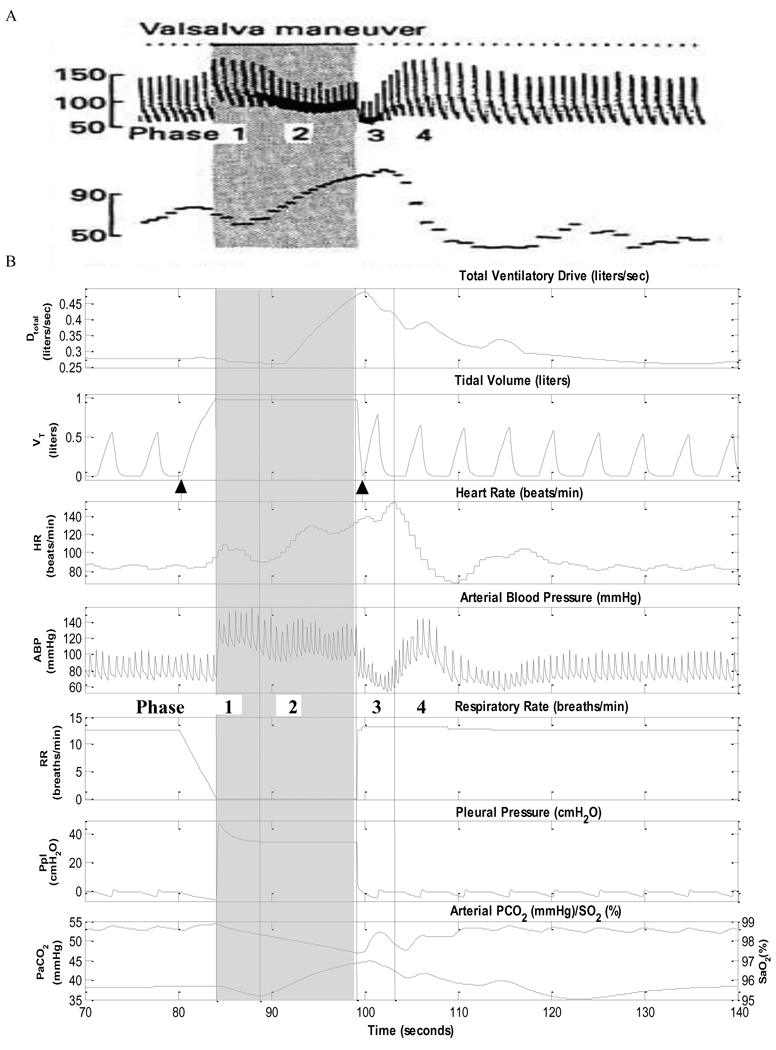
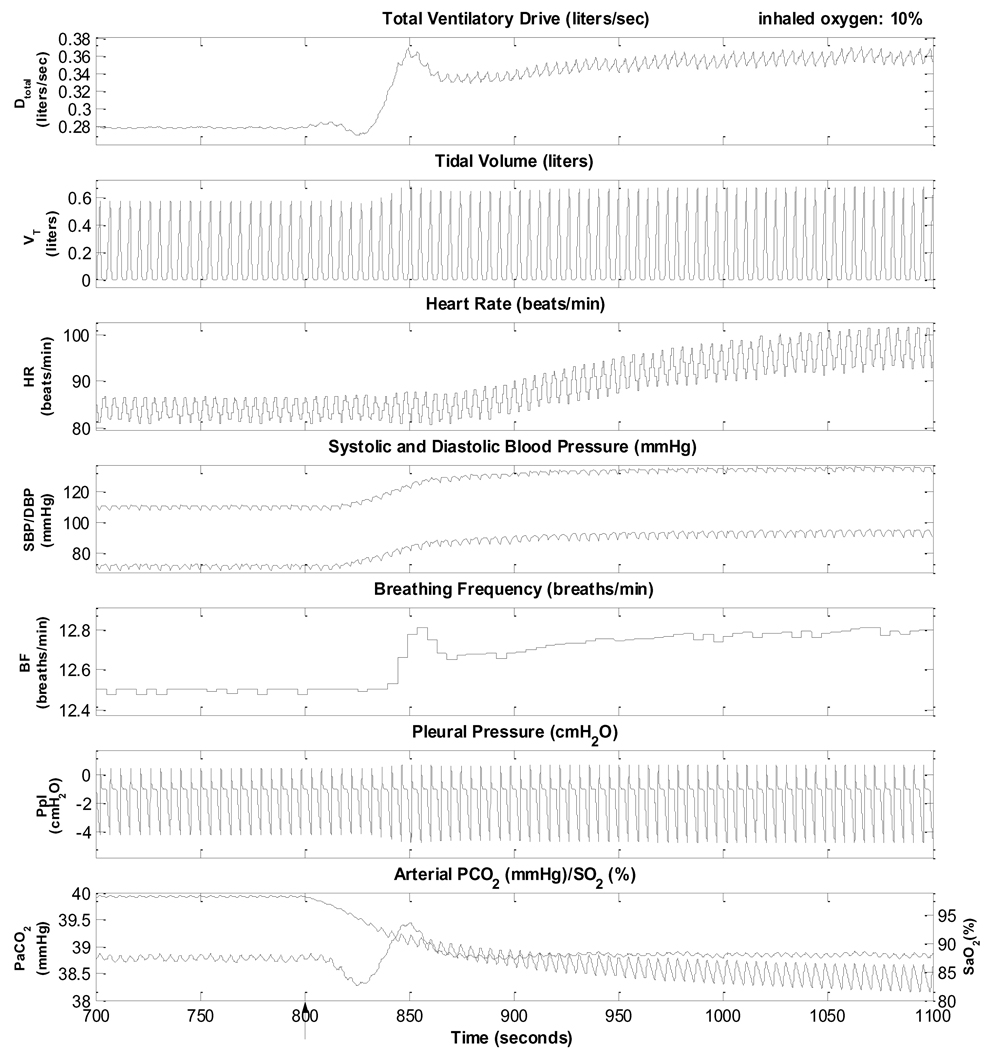
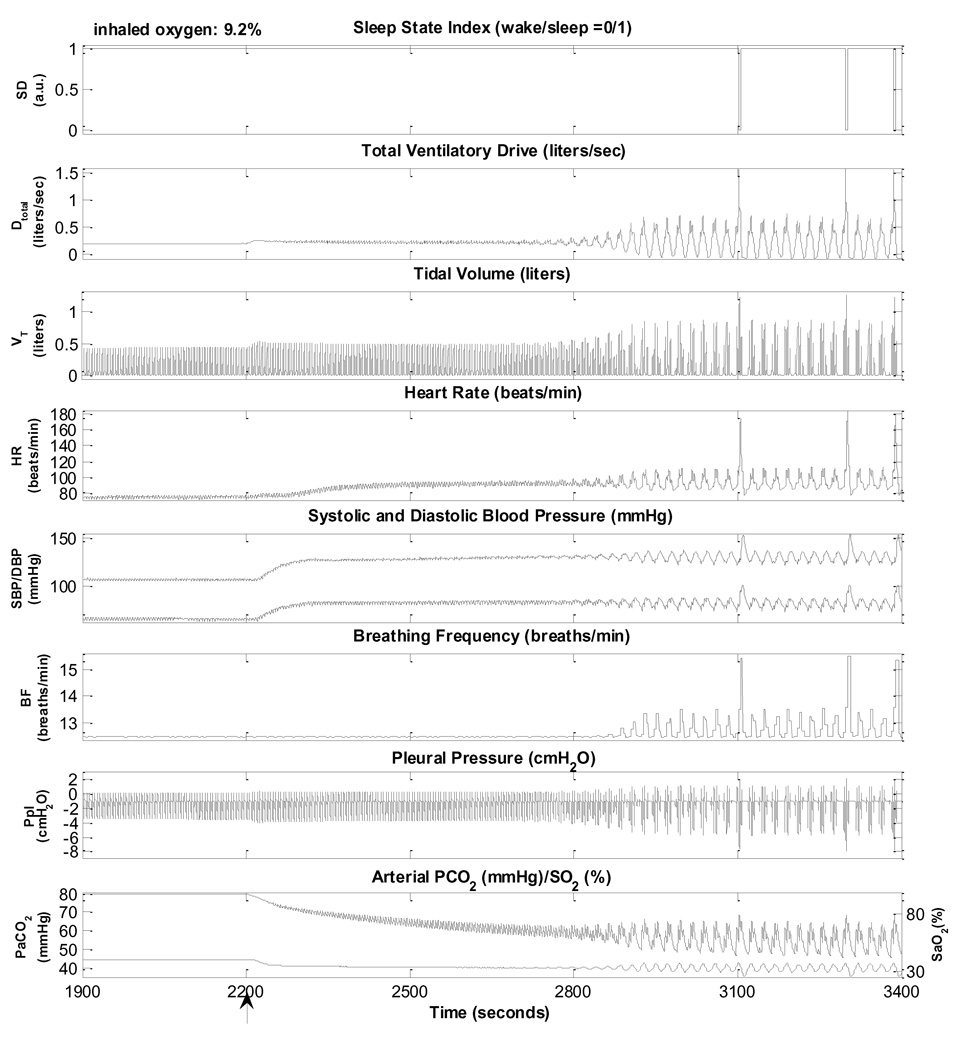
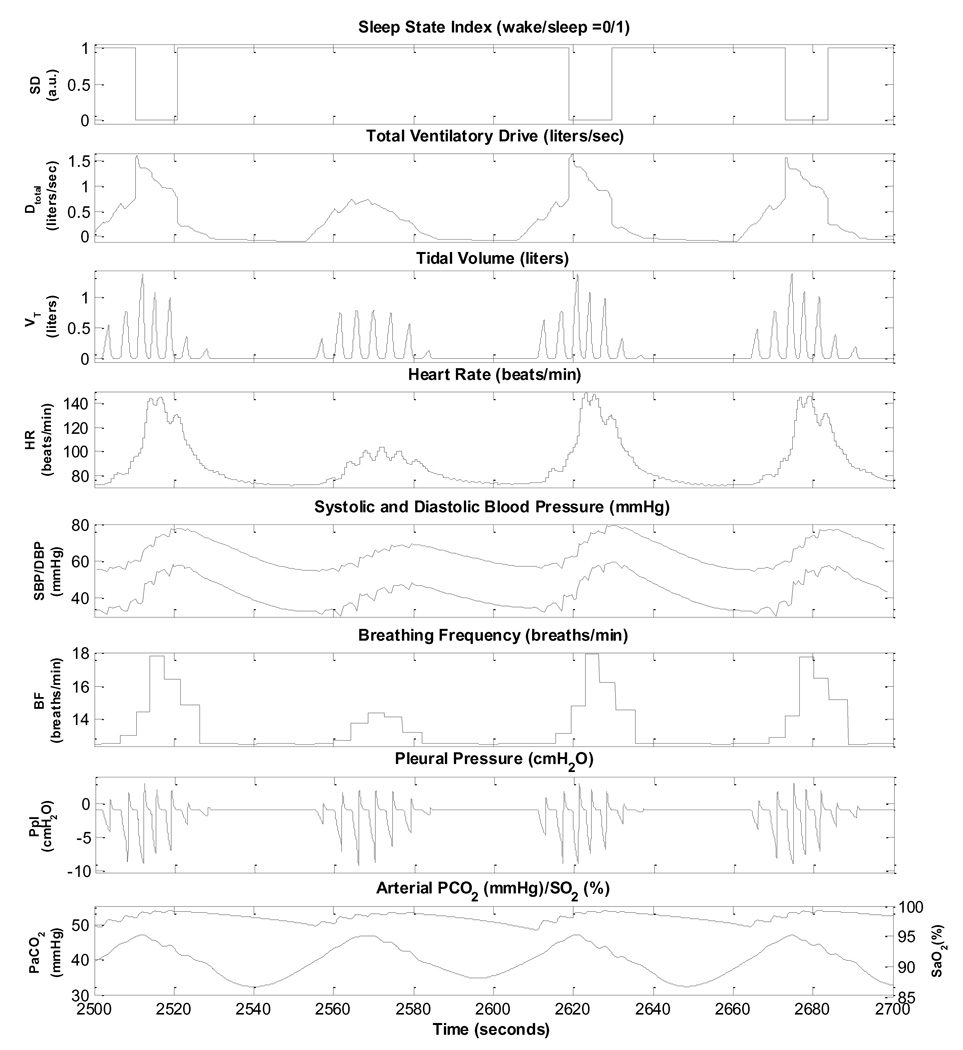
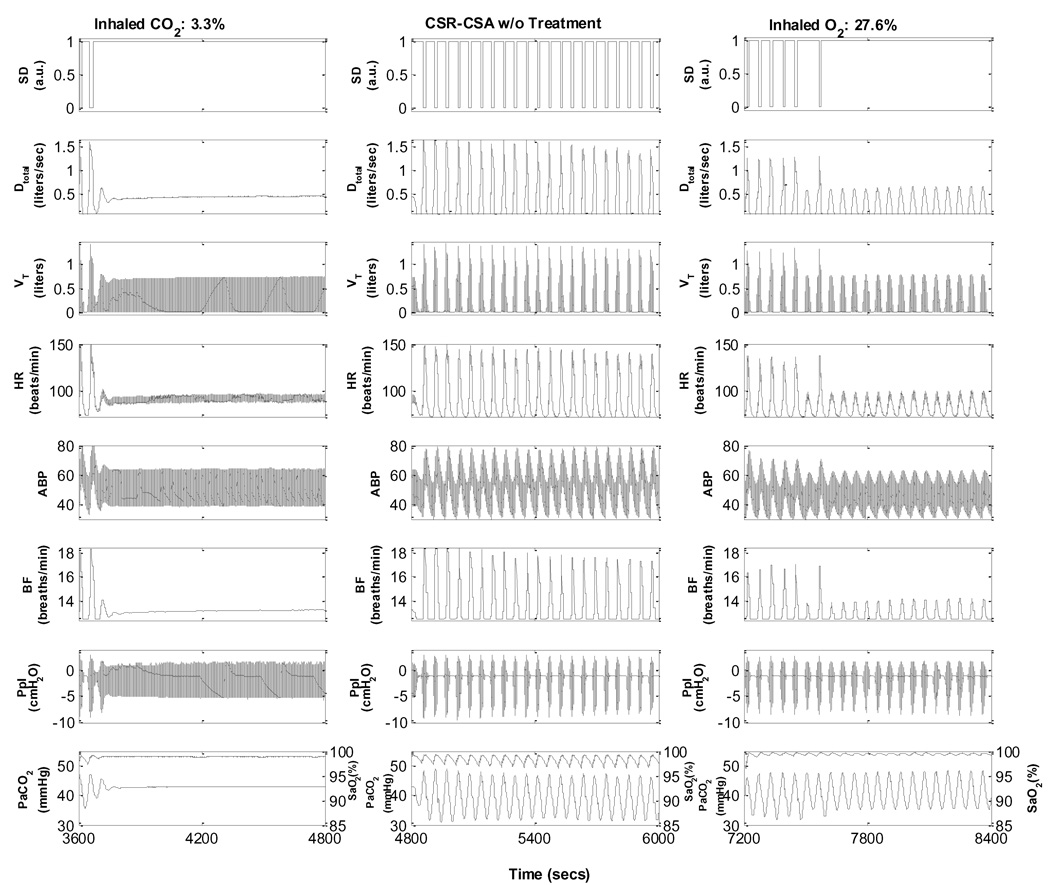
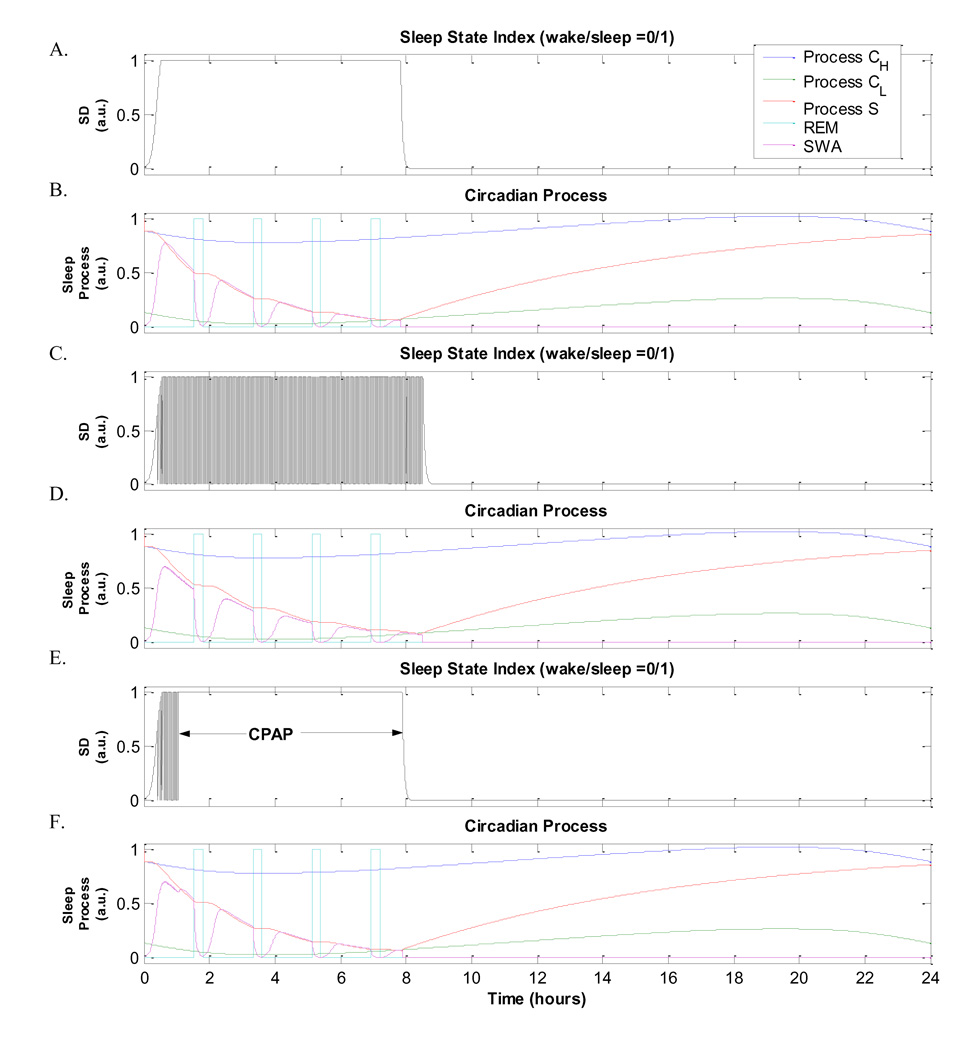
While many physiological control models exist in the literature, none thus far has focused on characterizing the interactions among the respiratory, cardiovascular and sleep-wake regulation systems that occur in sleep-disordered breathing. The model introduced in this study integrates the autonomic control of the cardiovascular system, chemoreflex and state-related control of respiration, including respiratory and upper airway mechanics, along with a model of circadian and sleep-wake regulation. The integrative model provides realistic predictions of the physiological responses under a variety of conditions including: the sleep-wake cycle, hypoxia-induced periodic breathing, Cheyne-Stokes respiration in chronic heart failure, and obstructive sleep apnoea (OSA). It can be used to investigate the effects of a variety of interventions, such as isocapnic and hypercapnic and/or hypoxic gas administration, the Valsalva and Mueller maneuvers, and the application of continuous positive airway pressure on OSA subjects. By being able to delineate the influences of the various interacting physiological mechanisms, the model is useful in providing a more lucid understanding of the complex dynamics that characterize state-cardiorespiratory control in the different forms of sleep-disordered breathing.


Figures

Fig. 1
Fig. 1
Schematic diagram of the integrative model of cardiovascular and respiratory interactions with sleep-wake state control.
Fig. 2
Fig. 2
Simulation of wakefulness to sleep transition in a normal subject.
Fig. 3
Fig. 3
Valsalva maneuver. A. Experimental data from Bannister (4). B. Model results. The maneuver begins at time 80 s with a deep inspiration and ends at ~100 s with release of the breathhold (indicated by arrows).
Fig. 4
Fig. 4
Simulation of isocapnic hypoxia. Inhaled oxygen is changed from 21% to 10%, starting at 800s (arrow).
Fig. 5
Fig. 5
Steady state cardiorespiratory responses of the model to various combinations of hypoxia (inhaled O2 = 8.5%) with hypocapnia (inhaled CO2 = 0%), normocapnia (inhaled CO2 = 2.63%) and hypercapnia (inhaled CO2 = 5.26%), displayed in terms of percent change from the baseline in normoxic normocapnia. SaO2: arterial blood oxygen saturation; PaO2: partial pressure of oxygen in arterial blood; PaCO2: partial pressure of carbon dioxide in arterial blood; HR: heart rate; SBP: systolic blood pressure; DBP: diastolic blood pressure; MAP: mean arterial blood pressure; Vt: tidal volume; BF: breathing frequency; CO: cardiac output; TPR: total peripheral resistance of all peripheral vasculature in the systemic circulation.
Fig. 6
Fig. 6
Simulation of obstructive sleep apnoea.
Fig. 7
Fig. 7
Simulation showing the development of obstructive sleep apnoea following sleep onset and the effect of subsequent CPAP administration (15 cmH2O), starting ~ 0.75 hour following the start of the simulation (as indicated by the arrow). Time 0 represents 100 seconds since the start of the simulation.
Fig. 8
Fig. 8
Simulations showing the development of obstructive sleep apnoea following sleep onset in an OSA subject with normal chemoreflex gains (left panel) and mixed apnoea in an OSA subject with peripheral chemoreflex gain increased six fold. Time 0 represents 1800 s since the start of the simulation.
Fig. 9
Fig. 9
Hypoxia-induced periodic breathing during sleep. Inhaled O2 is changed from 21% to 9.2%, starting at 2200s (arrow).
Fig. 10
Fig. 10
Simulation of Cheyne-Stokes respiration during sleep in a subject with chronic heart failure.
Fig. 11
Fig. 11
Simulation of the effects of CO2 and O2 inhalation on a CHF subject with CSR-CSA.
Fig. 12
Fig. 12
Simulations with the model over a 24-hour circadian cycle – comparison among different cases. Panels A and B: normal sleep; Panels C and D: OSA; Panels E and F: OSA with CPAP treatment.
Fig. 13
Fig. 13
Sensitivity analysis of the effects of hypoxia on blood pressure. Hypoxia is induced by lowering inhaled O2 from 21% to 8.5%. Control: both baroreflex and chemoreflex inputs to the autonomic nervous system are left intact. “Block Baroreflex”: baroreflex inputs are blocked. “Block Chemoreflex”: chemoreflex inputs are blocked.

References

    1. Achermann P, Borbely AA. Mathematical models of sleep regulation. Frontiers in Biosci. 2003;8:s683–s693. - PubMed
    1. Andreas S, Hagenah G, Moller C, Werner GS, Kreuzer H. Cheyne-Stokes respiration and prognosis in congestive heart failure. Am J Cardiol. 1996;78:1260–1264. - PubMed
    1. Bai J, Lu H, Zhang J, Zhou X. Simulation study of the interaction between respiration and the cardiovascular system. Methods Inf Med. 1997;36:261–263. - PubMed
    1. Bannister R. Defective baroreflex function in autonomic failure. In: Sleight P, editor. Arterial baroreceptors and hypertension. Oxford, UK: Oxford University Press; 1980. pp. 117–122.
    1. Baust W, Bohnert B. The regulation of heart rate during sleep. Exp Brain Res. 1969;7:169–180. - PubMed

Publication types