

Redefining the genetics of murine gammaherpesvirus 68 via transcriptome-based annotation
- PMID: 20542255
- PMCID: PMC2900189
- DOI: 10.1016/j.chom.2010.05.005
Redefining the genetics of murine gammaherpesvirus 68 via transcriptome-based annotation
Abstract
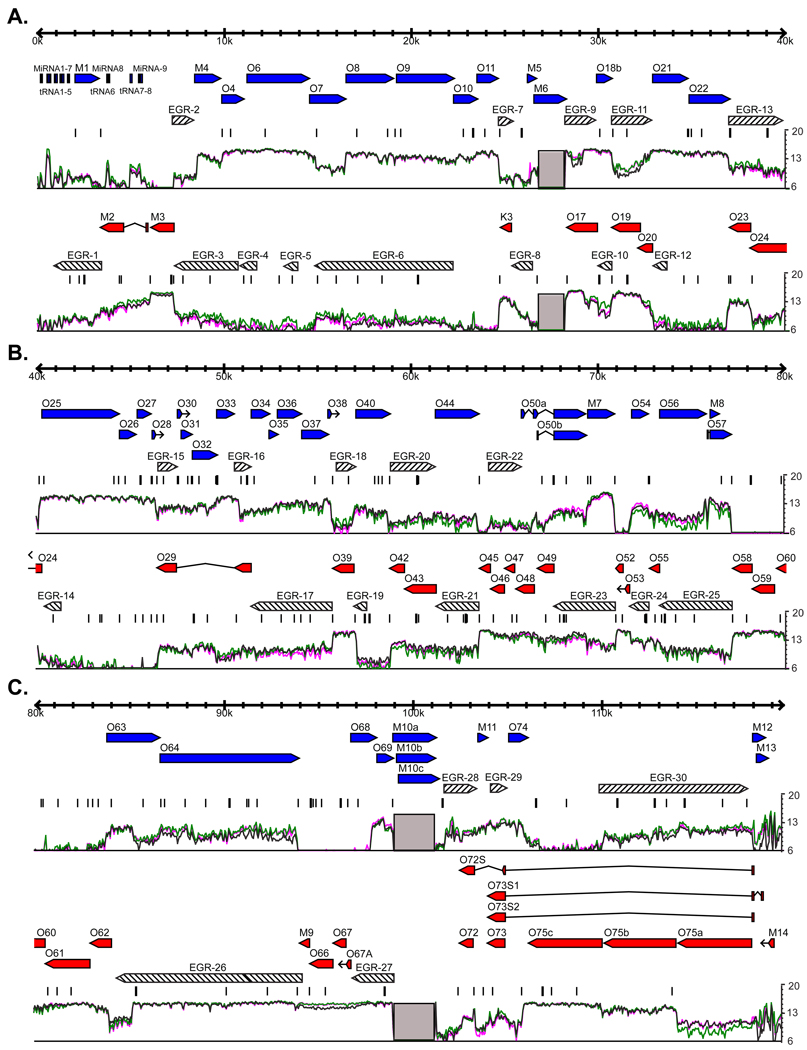
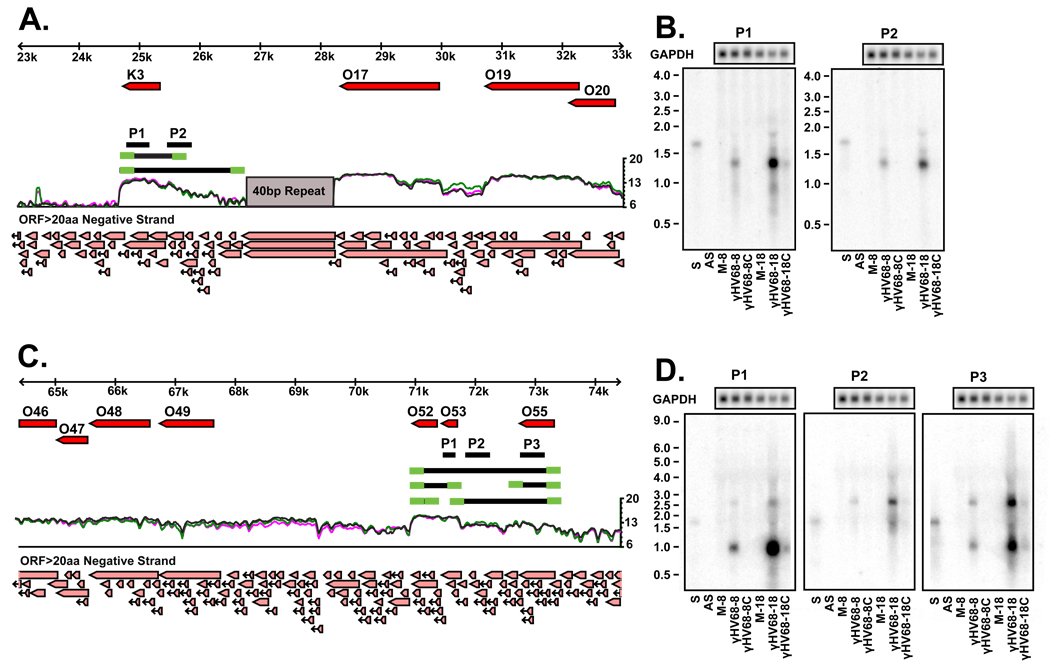
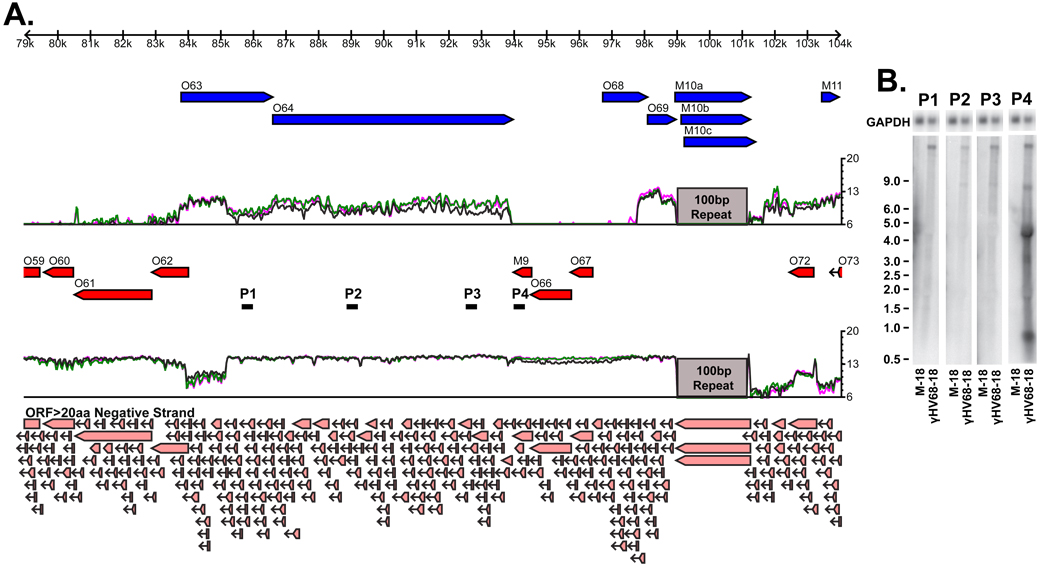
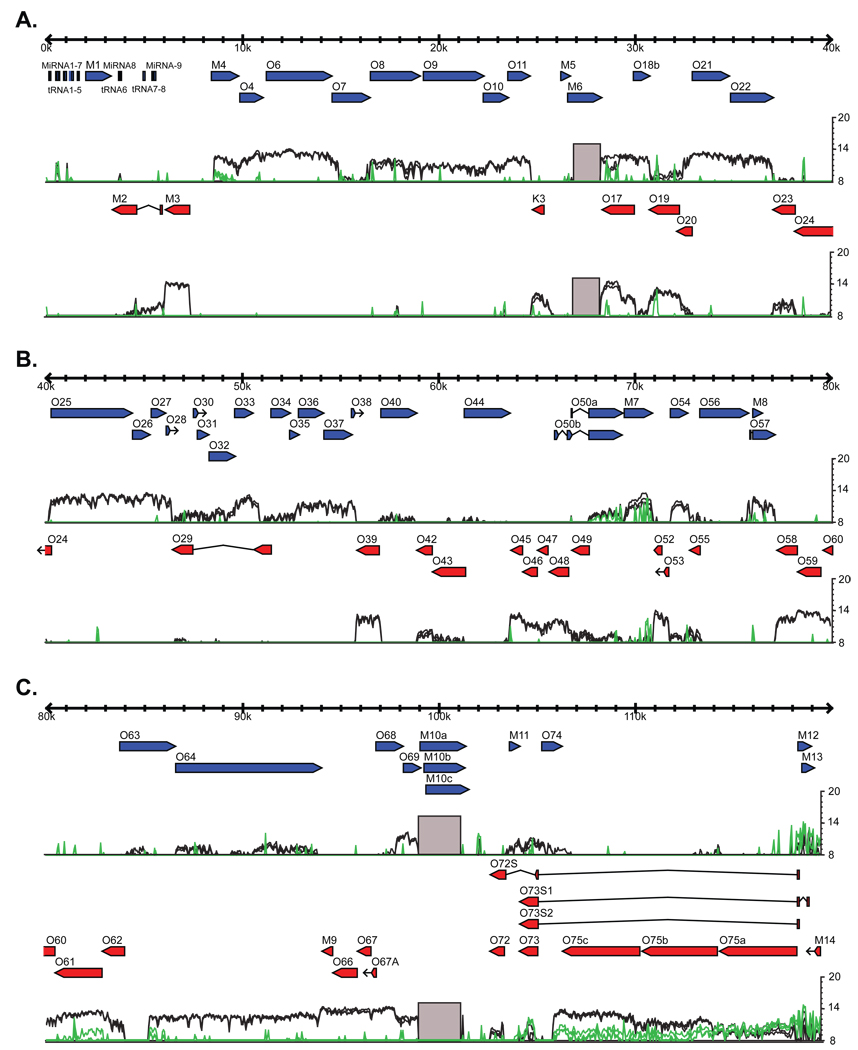
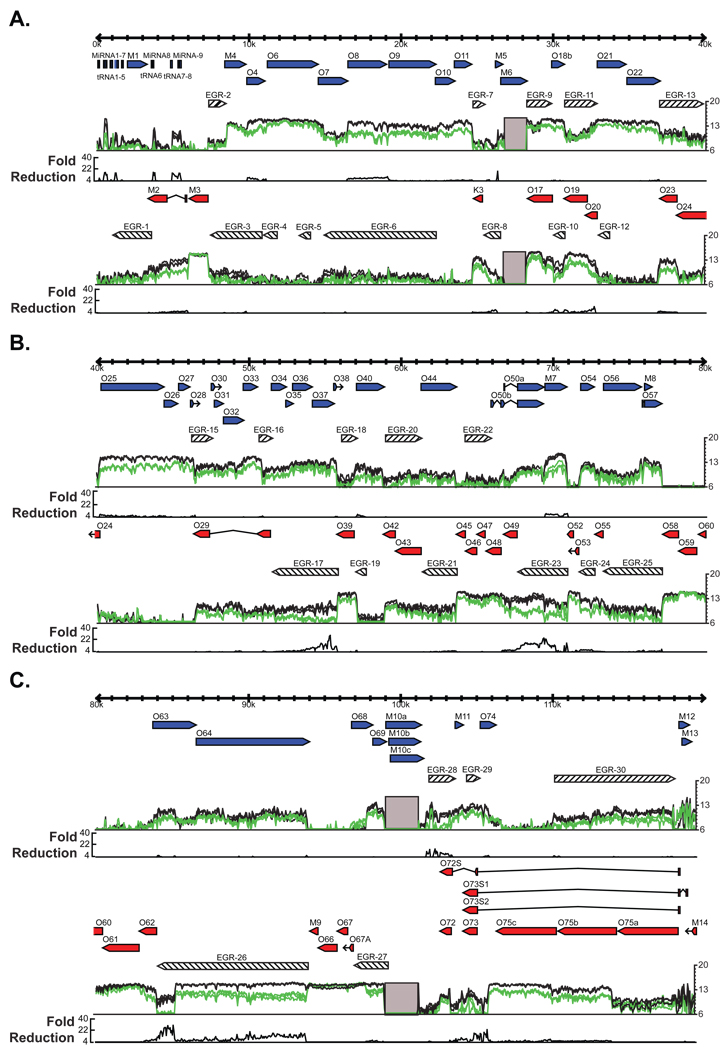
Viral genetic studies typically focus on large open reading frames (ORFs) identified during genome annotation (ORF-based annotation). Here we describe tools for examining viral gene expression nucleotide by nucleotide across the genome. Using these tools on the 119,450 base pair (bp) genome of murine gammaherpesvirus 68 (gammaHV68) allowed us to establish that gammaHV68 RNA expression was significantly more complex than predicted from ORF-based annotation, including over 73,000 nucleotides of unexpected transcription within 30 expressed genomic regions (EGRs). Approximately 90% of this RNA expression was antisense to genomic regions containing known large ORFs. We verified the existence of previously undefined transcripts in three EGRs and determined which parts of the transcriptome depend on protein or viral DNA synthesis. This study redefines the genetic map of gammaHV68, indicating that herpesviruses contain significantly more genetic complexity than predicted from ORF-based genome annotations, and provides alternative tools and approaches for viral genetic studies.
Copyright (c) 2010 Elsevier Inc. All rights reserved.
Figures
Similar articles
-
Pervasive transcription of a herpesvirus genome generates functionally important RNAs.mBio. 2014 Mar 11;5(2):e01033-13. doi: 10.1128/mBio.01033-13. mBio. 2014. PMID: 24618256 Free PMC article.
-
Three distinct regions of the murine gammaherpesvirus 68 genome are transcriptionally active in latently infected mice.J Virol. 1999 Mar;73(3):2321-32. doi: 10.1128/JVI.73.3.2321-2332.1999. J Virol. 1999. PMID: 9971815 Free PMC article.
-
Complete sequence and genomic analysis of murine gammaherpesvirus 68.J Virol. 1997 Aug;71(8):5894-904. doi: 10.1128/JVI.71.8.5894-5904.1997. J Virol. 1997. PMID: 9223479 Free PMC article.
-
Genome-wide Transcript Structure Resolution Reveals Abundant Alternate Isoform Usage from Murine Gammaherpesvirus 68.Cell Rep. 2019 Jun 25;27(13):3988-4002.e5. doi: 10.1016/j.celrep.2019.05.086. Cell Rep. 2019. PMID: 31242428 Free PMC article.
-
Transcription program of murine gammaherpesvirus 68.J Virol. 2003 Oct;77(19):10488-503. doi: 10.1128/jvi.77.19.10488-10503.2003. J Virol. 2003. PMID: 12970434 Free PMC article.
Cited by
-
Gammaherpesvirus Readthrough Transcription Generates a Long Non-Coding RNA That Is Regulated by Antisense miRNAs and Correlates with Enhanced Lytic Replication In Vivo.Noncoding RNA. 2019 Jan 10;5(1):6. doi: 10.3390/ncrna5010006. Noncoding RNA. 2019. PMID: 30634714 Free PMC article.
-
Pervasive transcription of a herpesvirus genome generates functionally important RNAs.mBio. 2014 Mar 11;5(2):e01033-13. doi: 10.1128/mBio.01033-13. mBio. 2014. PMID: 24618256 Free PMC article.
-
Identification and sequencing of a novel rodent gammaherpesvirus that establishes acute and latent infection in laboratory mice.J Virol. 2011 Mar;85(6):2642-56. doi: 10.1128/JVI.01661-10. Epub 2011 Jan 5. J Virol. 2011. PMID: 21209105 Free PMC article.
-
Amplification of JNK signaling is necessary to complete the murine gammaherpesvirus 68 lytic replication cycle.J Virol. 2012 Dec;86(24):13253-62. doi: 10.1128/JVI.01432-12. Epub 2012 Sep 26. J Virol. 2012. PMID: 23015701 Free PMC article.
-
Lytic Replication and Reactivation from B Cells Is Not Required for Establishing or Maintaining Gammaherpesvirus Latency In Vivo.J Virol. 2022 Jun 22;96(12):e0069022. doi: 10.1128/jvi.00690-22. Epub 2022 Jun 1. J Virol. 2022. PMID: 35647668 Free PMC article.
References
-
- Assarsson E, Greenbaum JA, Sundstrom M, Schaffer L, Hammond JA, Pasquetto V, Oseroff C, Hendrickson RC, Lefkowitz EJ, Tscharke DC, Sidney J, Grey HM, Head SR, Peters B, Sette A. Kinetic analysis of a complete poxvirus transcriptome reveals an immediate-early class of genes. Proc. Natl. Acad. Sci. U. S. A. 2008a;105:2140–2145. - PMC - PubMed
-
- Assarsson E, Greenbaum JA, Sundstrom M, Schaffer L, Hammond JA, Pasquetto V, Oseroff C, Hendrickson RC, Lefkowitz EJ, Tscharke DC, Sidney J, Grey HM, Head SR, Peters B, Sette A. Reply to Satheshkumar and Moss: Poxvirus transcriptom analysis. Proc. Natl. Acad. Sci. U. S. A. 2008b;105:E63–E64. - PMC - PubMed
Publication types
MeSH terms
Substances
Grants and funding
LinkOut - more resources
Full Text Sources
Molecular Biology Databases
