. 2010 Sep 1;49(5):800-13.
doi: 10.1016/j.freeradbiomed.2010.06.002. Epub 2010 Jun 8.

Mechanism for the protective effect of resveratrol against oxidative stress-induced neuronal death

Affiliations

Mechanism for the protective effect of resveratrol against oxidative stress-induced neuronal death

Masayuki Fukui et al. Free Radic Biol Med. .

Abstract

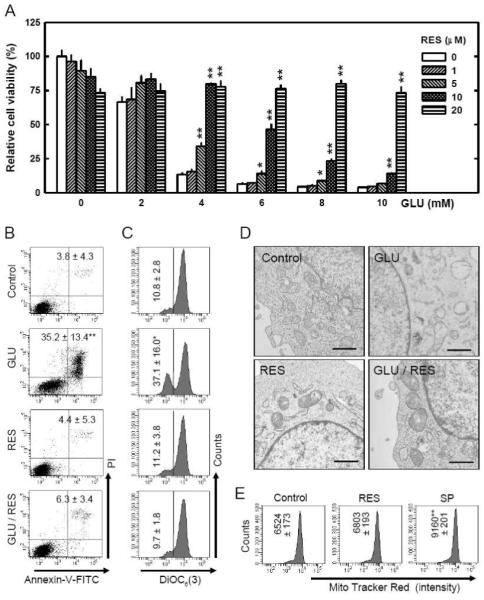
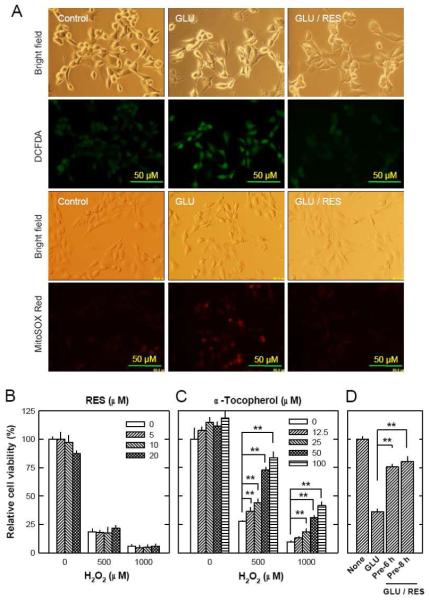
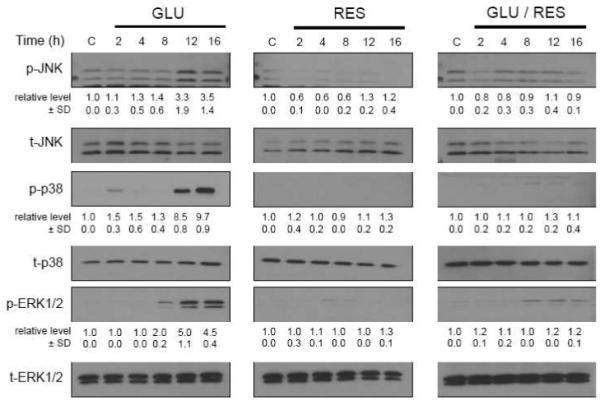
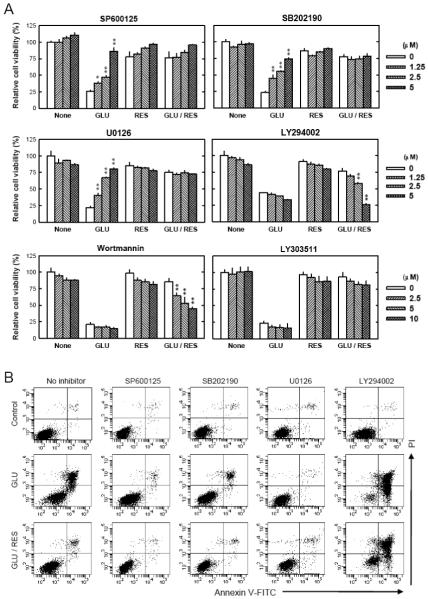
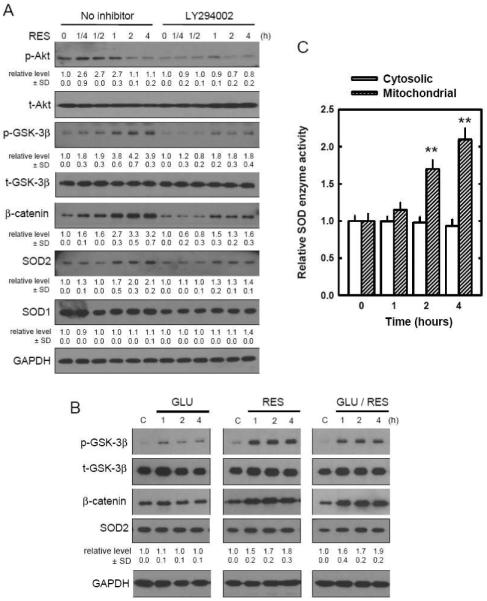
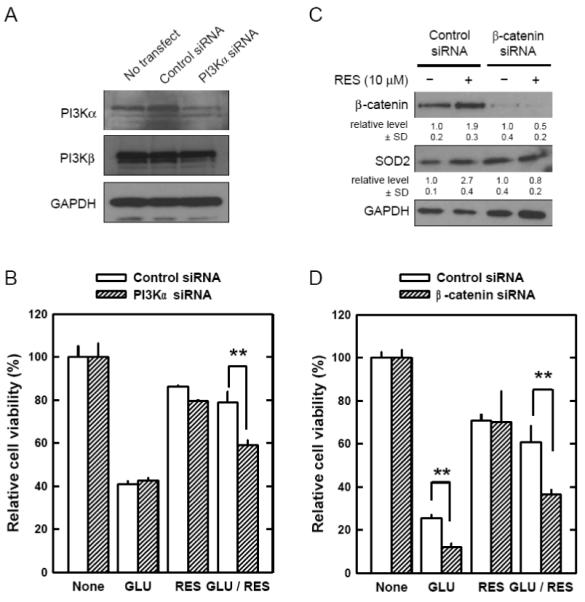
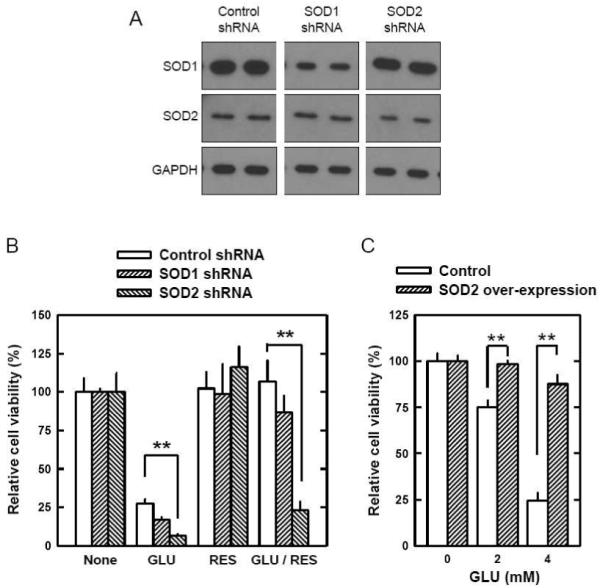
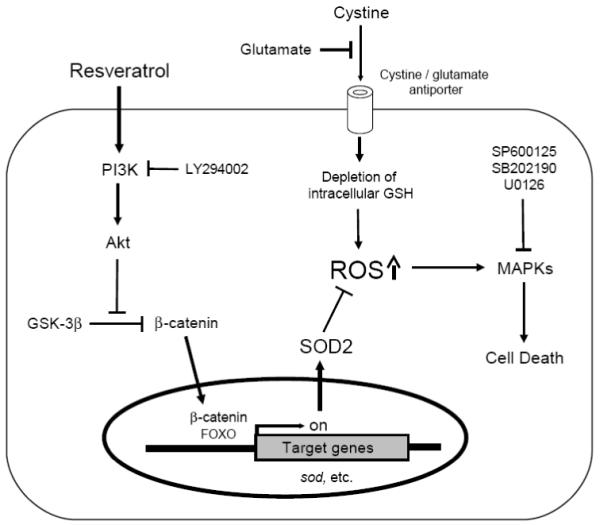
Oxidative stress can induce cytotoxicity in neurons, which plays an important role in the etiology of neuronal damage and degeneration. This study sought to determine the cellular and biochemical mechanisms underlying resveratrol's protective effect against oxidative neuronal death. Cultured HT22 cells, an immortalized mouse hippocampal neuronal cell line, were used as an in vitro model, and oxidative stress and neurotoxicity were induced in these neuronal cells by exposure to high concentrations of glutamate. Resveratrol strongly protected HT22 cells from glutamate-induced oxidative cell death. Resveratrol's neuroprotective effect was independent of its direct radical scavenging property, but instead was dependent on its ability to selectively induce the expression of mitochondrial superoxide dismutase (SOD2) and, subsequently, reduce mitochondrial oxidative stress and damage. The induction of mitochondrial SOD2 by resveratrol was mediated through the activation of the PI3K/Akt and GSK-3beta/beta-catenin signaling pathways. Taken together, the results of this study show that up-regulation of mitochondrial SOD2 by resveratrol represents an important mechanism for its protection of neuronal cells against oxidative cytotoxicity resulting from mitochondrial oxidative stress.


Figures

FIGURE 1
FIGURE 1. Resveratrol (RES) prevents HT22 cells from undergoing glutamate-induced apoptosis
A. HT22 cells were treated with resveratrol and/or glutamate at indicated concentrations for 24 hours. The MTT assay was used to determine cell viability. B and C. HT22 cells were treated with resveratrol (10 μM) and/or glutamate (4 mM) for 24 hours, and then stained with annexin-V and PI (B) or DiOC6(3) (C) as described in the Materials and Methods section, and then analyzed using a flow cytometer. The values as listed in the panels are the mean ± SD for the annexin-V/PI double positive cell population obtained from three separate experiments (B), or the mean ± SD for the DiOC6(3)-negative cell population, also from three separate experiments (C). D. HT22 cells were treated with resveratrol (10 μM) and/or glutamate (4 mM) for 12 hours, and then mitochondrial morphological changes were analyzed using the transmission electron microscopy as described in the Materials and Methods section. Scale bar = 1 μm. E. HT22 cells were treated with resveratrol (10 μM) or 50 mM sodium pyruvate (SP) for 24 hours and then stained with the MitoTracker Red FM as described in the Materials and Methods section, and then analyzed using a flow cytometer. Each value is the mean ± SD of three separate measurements. *P < 0.05, **P < 0.01 versus respective controls.
FIGURE 2
FIGURE 2. Resveratrol (RES) inhibits ROS formation
A. HT22 cells were treated with glutamate (4 mM) and resveratrol (10 μM) for 8 hours followed by incubation for 20 minutes with a fluorescent dye 2′,7′-dichlorodihydrofluorescin diacetate (H2-DCF-DA) at 10 μM (for detection of total cellular ROS) or MitoSOX Red at 5 μM (for detection mitochondrial ROS). Accumulation of cellular and mitochondrial ROS was observed and photographed using a fluorescence microscope (×200). B. HT22 cells were treated with resveratrol and/or hydrogen peroxide at indicated concentrations for 24 hours. The MTT assay was used to determine cell viability. C. HT22 cells were treated with α-tocopherol and/or hydrogen peroxide at indicated concentrations for 24 hours. The MTT assay was used to determine cell viability. D. HT22 cells were pre-treated with resveratrol (10 μM) for 6 or 8 hours and then resveratrol was removed immediately before addition of glutamate. Cells were incubated for 24 hours with glutamate in the absence of resveratrol. Cell viability was determined by using the MTT assay. Each value is mean ± SD of three independent experiments. *P < 0.05, **P < 0.01 versus respective controls.
FIGURE 3
FIGURE 3. Activation of JNK, p38 and ERK signaling pathways after glutamate and/or resveratrol treatment
HT22 cells were treated with glutamate (4 mM) and/or resveratrol (10 μM). After incubation for the indicated length of time, cell extracts were subjected to SDS-PAGE and immunoblotting with antibodies specific for phospho-JNK (Thr183/Tyr185), phospho-p38 (Thr180/Tyr182), and phospho-ERK (Thr202/Tyr204). Membranes were stripped and re-probed for total-JNK, total-p38, or total-ERK. The ratio of phosphorylated protein was calculated from three independent experiments (shown under each immunoblot of the phosphorylated protein). The relative protein level for the phosphorylated protein was calculated according to the densitometry reading of each band, which was then normalized according to the densitometry reading for the corresponding total protein level. The control group was arbitrarily set at 1.o for ease of comparison.
FIGURE 4
FIGURE 4. Role of JNK, p38, ERK and PI3K signaling pathways in mediating glutamate-induced cell death and the protective effect of resveratrol (RES)
A. HT22 cells were pre-treated with each of the inhibitors at 0-5 μM concentrations (SP600125 as a JNK inhibitor; SB202190 as a p38 inhibitor; U0126 as an ERK inhibitor; LY294002 and wortmannin as PI3K inhibitors) for 2 hours and then incubated with glutamate (4 mM) and/or resveratrol (10 μM) for additional 24 hours. In this experiment, LY303511, a structural analog of LY294002 but with no PI3K-inhibiting activity, was used as a negative control (0-10 μM) for LY294002. Cell viability was analyzed using the MTT assay. Each value is mean ± SD of three separate experiments. *P < 0.05, **P < 0.01 versus respective controls. B. HT22 cells were pre-treated with inhibitors (5 μM) for 2 hours and then incubated with glutamate (4 mM) and resveratrol (10 μM) for additional 24 hours. Cells were stained with annexin-V-FITC and PI as described in the Materials and Methods section, and then analyzed using a flow cytometer. These analyses were repeated multiple times, and similar observations were made. A representative data set was shown.
FIGURE 5
FIGURE 5. Induction of SOD by resveratrol (RES) via PI3K/Akt and GSK-3β/β-catenin signaling pathways
A. HT22 cells were pre-treated with 5 μM of LY294002 for 2 hours and then incubated with 10 μM of resveratrol for the indicated time. Cell extracts were subjected to SDS-PAGE and immunoblotting with antibodies specific for phospho-Akt(Ser 473), phospho-GSK-3β(Ser 9), β-catenin, SOD1, and SOD2. Membranes were stripped and re-probed for total-Akt, total-GSK-3β, or GAPDH (control). The relative protein levels for the phosphorylated Akt and GSK-3β were calculated according to their densitometry readings, which were then normalized according to the densitometry readings for the corresponding total protein levels. Similarly, the relative protein levels for β-catenin, SOD1 and SOD2 were normalized according to the GAPDH protein levels. The control group was arbitrarily set at 1.0 for ease of comparison. B. HT22 cells were treated with glutamate (4 mM) and/or resveratrol (10 μM) for indicated length of time. Cell extracts were subjected to SDS-PAGE and immunoblotting with antibodies specific for phospho-GSK-3β (Ser 9), β-catenin, and SOD2. Membranes were stripped and re-probed for total-GSK-3β and GAPDH (control). These analyses were repeated multiples, and similar observations were made. A representative data was shown. For the expression levels of SODs, the mean densitometry value ± SD was calculated from three separate experiments, with the mean of the control group arbitrarily set at 1.0. C. HT22 cells were treated with 10 μM resveratrol for the indicated hours. Mitochondrial and cytosolic fractions were isolated as described in Materials and Methods. The SOD enzymatic activity in each fraction was measured and normalized as a ratio relative to the control activity. Each value is mean ± SD of three independent experiments. **P < 0.01 versus respective controls.
FIGURE 6
FIGURE 6. Suppression of protective effect of resveratrol (RES) in HT22 cells by transfection with siRNA selectively targeting PI3K p110α or β-catenin
A. HT22 cells were transfected with control siRNA or PI3Kα siRNA, and 72 hours later cell extracts were prepared and subjected to SDS-PAGE and immunoblot analysis using antibodies specific for PI3K p110α, PI3K p110β, or GAPDH. B. HT22 cells were transfected with control siRNA or PI3Kα siRNA. After 48-hour incubation, cells were further incubated with glutamate (4 mM) and/or 10 μM resveratrol for additional 24 hours. Cell viability was determined using the MTT assay. C. HT22 cells were transfected with control siRNA or β-catenin siRNA, and 48 hours later cells were incubated with or without 10 μM resveratrol. After 24-hour incubation, cell extracts were prepared and subjected to SDS-PAGE and immunoblot analysis using antibodies specific for β-catenin, SOD2, or GAPDH. The relative protein levels for β-catenin and SOD2 were calculated according to their densitometry reading, which was normalized according to the corresponding reading for the GAPDH protein band. The corresponding groups without resveratrol treatment were arbitrarily set at 1.0. D. HT22 cells were transfected with control siRNA or β-catenin siRNA. After 48-hour incubation, cells were further incubated with glutamate (4 mM) and/or 10 μM resveratrol for additional 24 hours. Cell viability was determined using the MTT assay. Each value is mean ± SD from three independent experiments. ** P < 0.01 versus respective controls.
FIGURE 7
FIGURE 7. Role of mitochondrial SOD2 levels in modulating the protective effect of resveratrol (RES) in HT22 cells
A. HT22 cells were stably transfected with the shRNA plasmid for SOD1, SOD2, or the control plasmid as described in the Materials and Methods section. Cell extracts from SOD1 shRNA, SOD2 shRNA and control cells were subjected to SDS-PAGE and immunoblotting with antibodies specific for SOD1, SOD2 and GAPDH as a control. B. Control, SOD1 and SOD2 shRNA cells were treated with glutamate (4 mM) and/or resveratrol (10 μM) for 24 hours. Cell viability was determined by using the MTT assay. C. HT22 cells that were stably transfected with a SOD2 expression plasmid or a mock plasmid (described in Methods) were treated with glutamate at indicated concentrations for 24 h. Cell viability was determined using the MTT assay. Each value is mean ± SD from three independent experiments. **P < 0.01 versus respective controls.
FIGURE 8
FIGURE 8. Schematic illustration of the mechanism underlying the protective effect of resveratrol (RES) against glutamate-induced cell death in HT22 cells
High concentrations of extracellular glutamate induce oxidative stress as a result of inhibition of cystine uptake and subsequently depletion of intracellular glutathione [5]. Elevated levels of intracellular ROS activate MAPK signaling pathways and subsequently induce cell death. Resveratrol (RES) can activate the PI3K/Akt signaling pathways, and the activated Akt subsequently inactivates GSK-3β and stabilizes β-catenin. The stabilized β-catenin translocates into the nuclei, binds to TCF family transcription factors or FOXO, and induces the expression of target genes, including SOD2. SOD2 proteins quench ROS that are accumulated in the mitochondria as a result of glutathione depletion. Collectively, resveratrol confers strong protection against glutamate-induced oxidative stress and neuronal cell death in HT22 cells.

Similar articles

Cited by

References

    1. Coyle JT, Puttfarcken P. Oxidative stress, glutamate, and neurodegenerative disorders. Science. 1993;262:689–695. - PubMed
    1. Blandini F, Porter RH, Greenamyre JT. Glutamate and Parkinson’s desease. Mol. Neurobiol. 1996;12:73–94. - PubMed
    1. Choi DW. Glutamate neurotoxicity and diseases of nervous system. Neuron. 1988;1:623–634. - PubMed
    1. Choi DW. Exitotoxic cell death. J. Neurobiol. 1992;23:1261–1276. - PubMed
    1. Murphy TH, Miyamoto M, Sastre A, Schnaar RL, Coyle JT. Glutamate toxicity in neuronal cell line involves inhibition of cystine transport leading to oxidative stress. Neuron. 1989;2:1547–1558. - PubMed

Publication types

MeSH terms

LinkOut - more resources