Positive T cell co-stimulation by TLR7/8 ligands is dependent on the cellular environment
- PMID: 20542588
- PMCID: PMC2964431
- DOI: 10.1016/j.imbio.2010.03.011
Positive T cell co-stimulation by TLR7/8 ligands is dependent on the cellular environment
Abstract
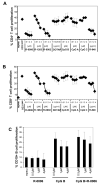
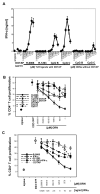
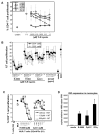
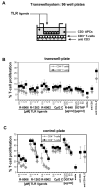
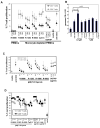
Toll-like receptors (TLRs) are mediators of innate immune responses detecting conserved pathogen-associated molecules. Whereas most TLRs are expressed on the cell surface, TLR3, 7, 8 and 9 are predominantly localized in endosomal compartments. Recent studies reported that TLRs are also expressed by T lymphocytes, resulting in direct co-stimulation of isolated CD4(+) T cells for example by Pam3CSK4 (TLR2 ligand) or flagellin (TLR5 ligand). We here describe enhanced IFN-γ production and T cell proliferation by anti-CD3 T cell receptor (TCR) or antigenic stimulation of purified human CD4(+) T cells upon co-culture with TLR7/8 specific single-stranded oligoribonucleotides or small molecule ligands. Surprisingly, TLR7/8 stimulation of CD4(+) T cells within a whole peripheral mononuclear cell (PBMC) environment did not result in enhanced T cell proliferation, but in a lack of proliferation that was cell-cell contact dependent. Immune cell depletion assays pointed towards a monocyte-mediated effect. Different TLR ligands influenced T cell proliferation differently. The effect of inhibition of T cell proliferation was most prominently seen for TLR7 ligands whereas the effects were minimal for TLR8 and TLR9 ligands indicating that the suppressive phenotype is unique only for certain TLRs. Our results strongly suggest that co-stimulation of T cell proliferation by TLR7/8 agonists is dependent on the specific cellular context.
Copyright © 2010 Elsevier GmbH. All rights reserved.
Figures


Similar articles
-
Activation of Human γδ T Cells: Modulation by Toll-Like Receptor 8 Ligands and Role of Monocytes.Cells. 2020 Mar 13;9(3):713. doi: 10.3390/cells9030713. Cells. 2020. PMID: 32183240 Free PMC article.
-
Direct stimulation of human T cells via TLR5 and TLR7/8: flagellin and R-848 up-regulate proliferation and IFN-gamma production by memory CD4+ T cells.J Immunol. 2005 Aug 1;175(3):1551-7. doi: 10.4049/jimmunol.175.3.1551. J Immunol. 2005. PMID: 16034093
-
The dysfunctional innate immune response triggered by Toll-like receptor activation is restored by TLR7/TLR8 and TLR9 ligands in cutaneous lichen planus.Br J Dermatol. 2015 Jan;172(1):48-55. doi: 10.1111/bjd.13214. Epub 2014 Nov 20. Br J Dermatol. 2015. PMID: 24976336
-
The use of TLR7 and TLR8 ligands for the enhancement of cancer immunotherapy.Oncologist. 2008 Aug;13(8):859-75. doi: 10.1634/theoncologist.2008-0097. Epub 2008 Aug 13. Oncologist. 2008. PMID: 18701762 Review.
-
Toll-like receptors 7, 8, and 9: linking innate immunity to autoimmunity.Immunol Rev. 2007 Dec;220:251-69. doi: 10.1111/j.1600-065X.2007.00572.x. Immunol Rev. 2007. PMID: 17979852 Review.
Cited by
-
Contrasting roles for TLR ligands in HIV-1 pathogenesis.PLoS One. 2010 Sep 20;5(9):e12831. doi: 10.1371/journal.pone.0012831. PLoS One. 2010. PMID: 20862220 Free PMC article.
-
Cellular Sensors and Viral Countermeasures: A Molecular Arms Race between Host and SARS-CoV-2.Viruses. 2023 Jan 26;15(2):352. doi: 10.3390/v15020352. Viruses. 2023. PMID: 36851564 Free PMC article. Review.
-
Impact of SARS-CoV-2 vaccination and of seasonal variations on the innate immune inflammatory response.Front Immunol. 2025 Jan 14;15:1513717. doi: 10.3389/fimmu.2024.1513717. eCollection 2024. Front Immunol. 2025. PMID: 39877354 Free PMC article.
-
Epithelial cell coculture models for studying infectious diseases: benefits and limitations.J Biomed Biotechnol. 2011;2011:852419. doi: 10.1155/2011/852419. Epub 2011 Oct 5. J Biomed Biotechnol. 2011. PMID: 22007147 Free PMC article. Review.
-
Activation of Human γδ T Cells: Modulation by Toll-Like Receptor 8 Ligands and Role of Monocytes.Cells. 2020 Mar 13;9(3):713. doi: 10.3390/cells9030713. Cells. 2020. PMID: 32183240 Free PMC article.
References
-
- Abreu MT, Arditi M. Innate immunity and toll-like receptors: clinical implications of basic science research. J. Pediatr. 2004;144:421–429. - PubMed
-
- Ahmad-Nejad P, Hacker H, Rutz M, Bauer S, Vabulas RM, Wagner H. Bacterial CpG-DNA and lipopolysaccharides activate Toll-like receptors at distinct cellular compartments. Eur. J. Immunol. 2002;32:1958–1968. - PubMed
-
- Akira S, Takeda K. Toll-like receptor signalling. Nat. Rev. Immunol. 2004;4:499–511. - PubMed
-
- Akira S, Takeda K, Kaisho T. Toll-like receptors: critical proteins linking innate and acquired immunity. Nat. Immunol. 2001;2:675–680. - PubMed
-
- Bekeredjian-Ding I, Roth SI, Gilles S, Giese T, Ablasser A, Hornung V, Endres S, Hartmann G. T Cell-Independent, TLR-Induced IL-12p70 Production in Primary Human Monocytes. J. Immunol. 2006;176:7438–7446. - PubMed
Publication types
MeSH terms
Substances
Grants and funding
LinkOut - more resources
Full Text Sources
Research Materials
Miscellaneous

