

Connected speech production in three variants of primary progressive aphasia
- PMID: 20542982
- PMCID: PMC2892940
- DOI: 10.1093/brain/awq129
Connected speech production in three variants of primary progressive aphasia
Abstract
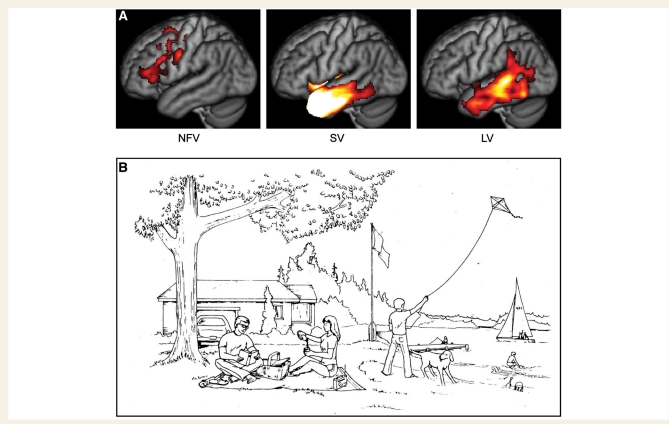
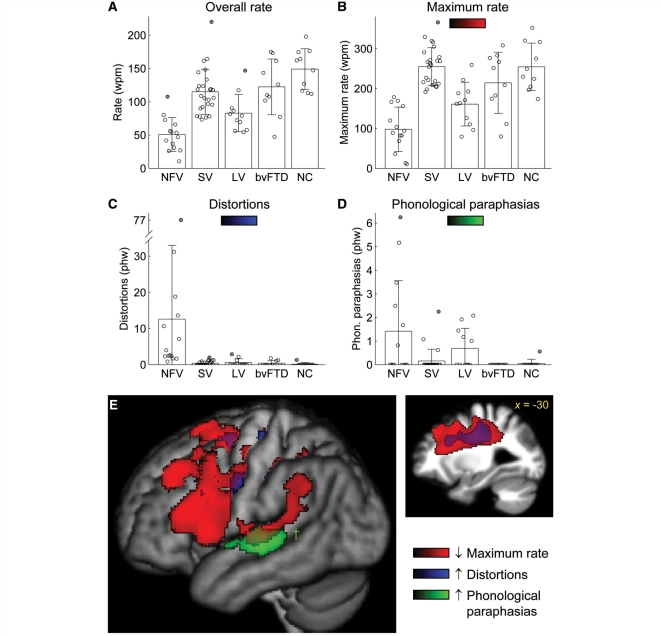
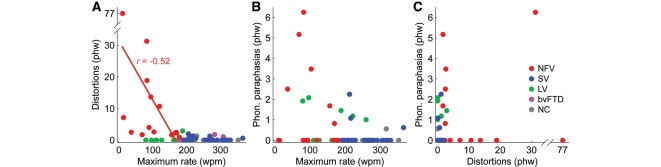
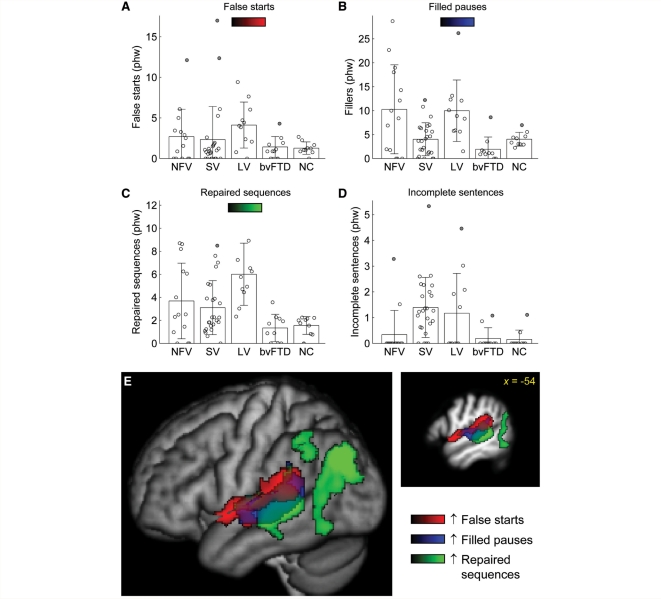
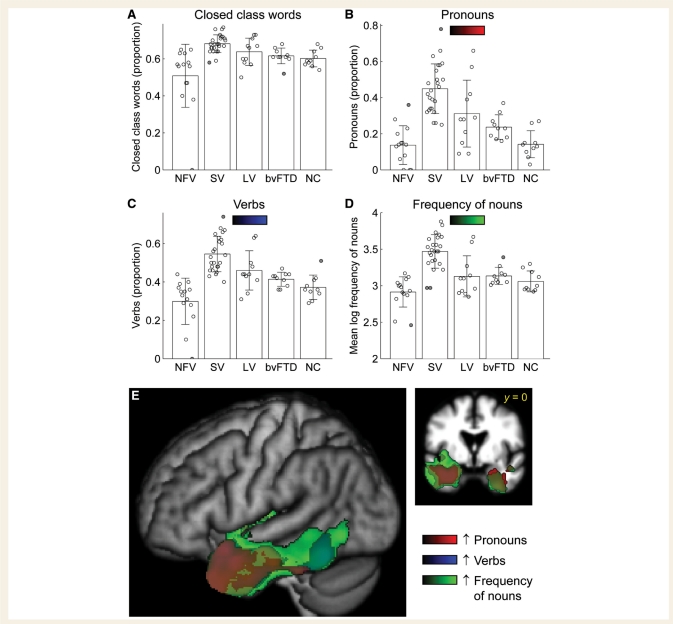
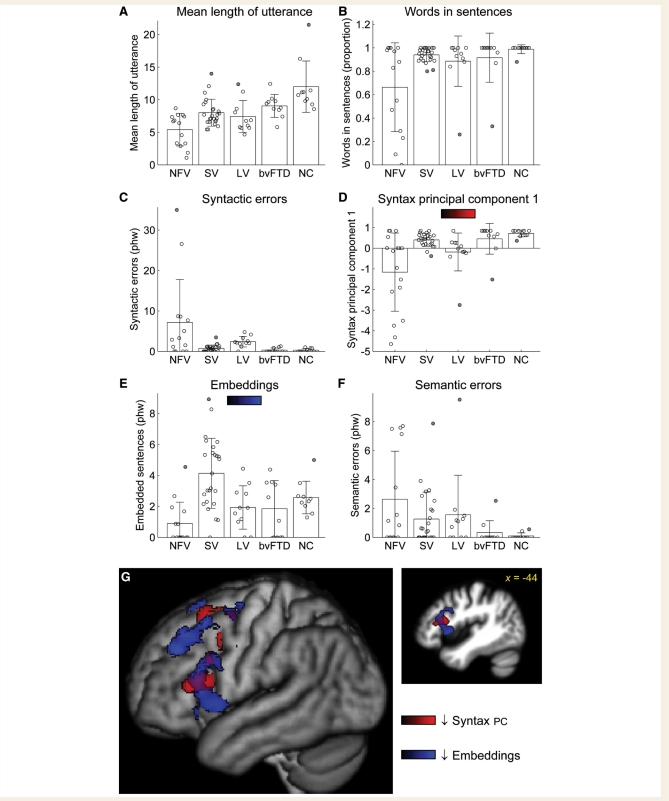
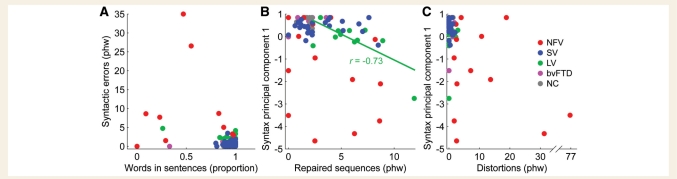
Primary progressive aphasia is a clinical syndrome defined by progressive deficits isolated to speech and/or language, and can be classified into non-fluent, semantic and logopenic variants based on motor speech, linguistic and cognitive features. The connected speech of patients with primary progressive aphasia has often been dichotomized simply as 'fluent' or 'non-fluent', however fluency is a multidimensional construct that encompasses features such as speech rate, phrase length, articulatory agility and syntactic structure, which are not always impacted in parallel. In this study, our first objective was to improve the characterization of connected speech production in each variant of primary progressive aphasia, by quantifying speech output along a number of motor speech and linguistic dimensions simultaneously. Secondly, we aimed to determine the neuroanatomical correlates of changes along these different dimensions. We recorded, transcribed and analysed speech samples for 50 patients with primary progressive aphasia, along with neurodegenerative and normal control groups. Patients were scanned with magnetic resonance imaging, and voxel-based morphometry was used to identify regions where atrophy correlated significantly with motor speech and linguistic features. Speech samples in patients with the non-fluent variant were characterized by slow rate, distortions, syntactic errors and reduced complexity. In contrast, patients with the semantic variant exhibited normal rate and very few speech or syntactic errors, but showed increased proportions of closed class words, pronouns and verbs, and higher frequency nouns, reflecting lexical retrieval deficits. In patients with the logopenic variant, speech rate (a common proxy for fluency) was intermediate between the other two variants, but distortions and syntactic errors were less common than in the non-fluent variant, while lexical access was less impaired than in the semantic variant. Reduced speech rate was linked with atrophy to a wide range of both anterior and posterior language regions, but specific deficits had more circumscribed anatomical correlates. Frontal regions were associated with motor speech and syntactic processes, anterior and inferior temporal regions with lexical retrieval, and posterior temporal regions with phonological errors and several other types of disruptions to fluency. These findings demonstrate that a multidimensional quantification of connected speech production is necessary to characterize the differences between the speech patterns of each primary progressive aphasic variant adequately, and to reveal associations between particular aspects of connected speech and specific components of the neural network for speech production.
Figures
Similar articles
-
Healthy brain connectivity predicts atrophy progression in non-fluent variant of primary progressive aphasia.Brain. 2016 Oct;139(Pt 10):2778-2791. doi: 10.1093/brain/aww195. Epub 2016 Aug 6. Brain. 2016. PMID: 27497488 Free PMC article.
-
Agraphia.2025 Apr 26. In: StatPearls [Internet]. Treasure Island (FL): StatPearls Publishing; 2025 Jan–. 2025 Apr 26. In: StatPearls [Internet]. Treasure Island (FL): StatPearls Publishing; 2025 Jan–. PMID: 32809557 Free Books & Documents.
-
Differentiating primary progressive aphasias in a brief sample of connected speech.Neurology. 2013 Jul 23;81(4):329-36. doi: 10.1212/WNL.0b013e31829c5d0e. Epub 2013 Jun 21. Neurology. 2013. PMID: 23794681 Free PMC article.
-
Understanding the multidimensional cognitive deficits of logopenic variant primary progressive aphasia.Brain. 2022 Sep 14;145(9):2955-2966. doi: 10.1093/brain/awac208. Brain. 2022. PMID: 35857482 Free PMC article. Review.
-
Primary Progressive Aphasia and Stroke Aphasia.Continuum (Minneap Minn). 2018 Jun;24(3, BEHAVIORAL NEUROLOGY AND PSYCHIATRY):745-767. doi: 10.1212/CON.0000000000000618. Continuum (Minneap Minn). 2018. PMID: 29851876 Free PMC article. Review.
Cited by
-
Syntactic and morphosyntactic processing in stroke-induced and primary progressive aphasia.Behav Neurol. 2013;26(1-2):35-54. doi: 10.3233/BEN-2012-110220. Behav Neurol. 2013. PMID: 22713394 Free PMC article.
-
Grammatical Impairments in PPA.Aphasiology. 2014 Sep;28(8-9):1018-1037. doi: 10.1080/02687038.2014.912744. Aphasiology. 2014. PMID: 25642014 Free PMC article.
-
The non-fluent/agrammatic variant of primary progressive aphasia.Lancet Neurol. 2012 Jun;11(6):545-55. doi: 10.1016/S1474-4422(12)70099-6. Epub 2012 May 16. Lancet Neurol. 2012. PMID: 22608668 Free PMC article. Review.
-
Neural underpinning of Japanese particle processing in non-native speakers.Sci Rep. 2022 Nov 5;12(1):18740. doi: 10.1038/s41598-022-23382-8. Sci Rep. 2022. PMID: 36335170 Free PMC article.
-
The neural basis of syntactic deficits in primary progressive aphasia.Brain Lang. 2012 Sep;122(3):190-8. doi: 10.1016/j.bandl.2012.04.005. Epub 2012 Apr 29. Brain Lang. 2012. PMID: 22546214 Free PMC article. Review.
References
-
- Amici S, Ogar J, Brambati SM, Miller BL, Neuhaus J, Dronkers NL, et al. Performance in specific language tasks correlates with regional volume changes in progressive aphasia. Cogn Behav Neurol. 2007b;20:203–11. - PubMed
-
- Ash S, Moore P, Antani S, McCawley G, Work M, Grossman M. Trying to tell a tale: discourse impairments in progressive aphasia and frontotemporal dementia. Neurology. 2006;66:1405–13. - PubMed
