

Population turnover in a Microcystis bloom results in predominantly nontoxigenic variants late in the season
- PMID: 20543038
- PMCID: PMC2916505
- DOI: 10.1128/AEM.00001-10
Population turnover in a Microcystis bloom results in predominantly nontoxigenic variants late in the season
Abstract
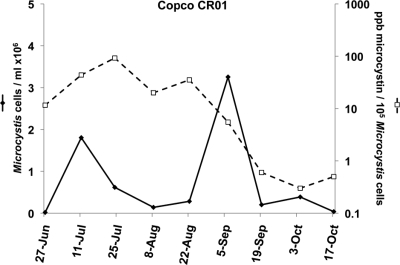
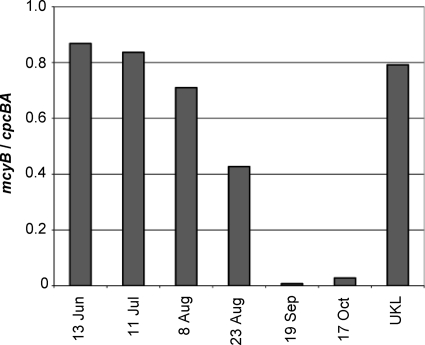
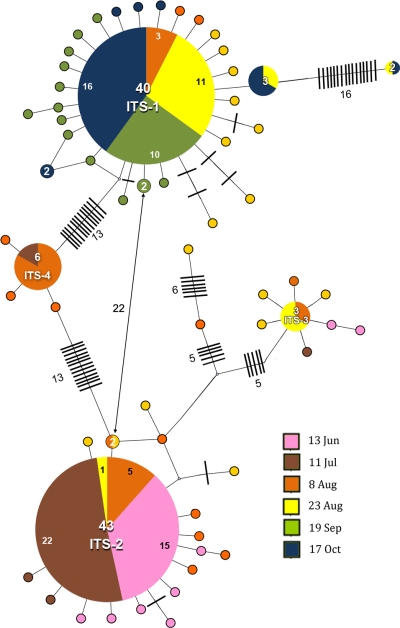
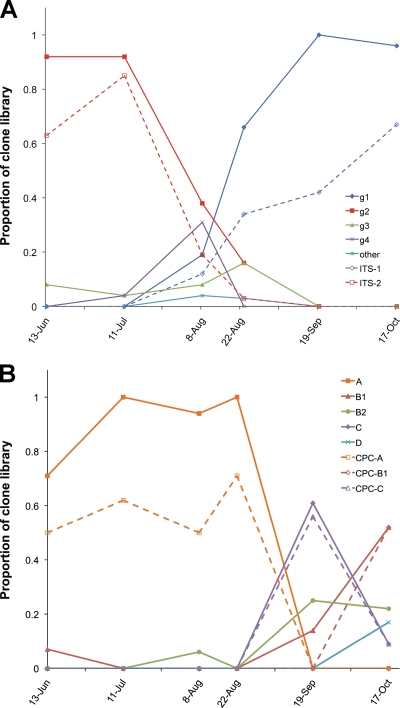
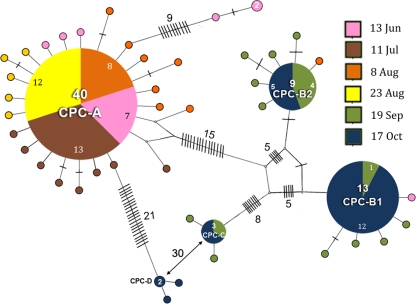
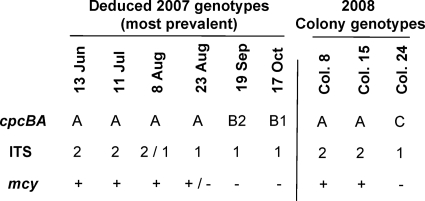
Surface samples of the 2007 Microcystis bloom occurring in Copco Reservoir on the Klamath River in Northern California were analyzed genetically by sequencing clone libraries made with amplicons at three loci: the internal transcribed spacer of the rRNA operon (ITS), cpcBA, and mcyA. Samples were taken between June and October, during which time two cell count peaks occurred, in mid-July and early September. The ITS and cpcBA loci could be classified into four or five allele groups, which provided a convenient means for describing the Microcystis population and its changes over time. Each group was numerically dominated by a single, highly represented sequence. Other members of each group varied by changes at 1 to 3 nucleotide positions, while groups were separated by up to 30 nucleotide differences. As deduced by a partial sampling of the clone libraries, there were marked population turnovers during the season, indicated by changes in allele composition at both the ITS and cpcBA loci. Different ITS and cpcBA genotypes appeared to be dominant at the two population peaks. Toxicity (amount of microcystin per cell) and toxigenic potential (mcyB copy number) were lower during the second peak, and the mcyB copy number fell further as the bloom declined.
Figures
References
-
- Allender, C. J., G. R. LeCleir, J. M. Rinta-Kanto, R. L. Small, M. F. Satchwell, G. L. Boyer, and S. W. Wilhelm. 2009. Identifying the source of unknown microcystin genes and predicting microcystin variants by comparing genes within uncultured cyanobacterial cells. Appl. Environ. Microbiol. 75:3598-3604. - PMC - PubMed
-
- Bittencourt-Oliveira, M. C., M. C. Oliveira, and C. J. S. Bolch. 2001. Genetic variability of Brazilian strains of the Microcystis aeruginosa complex (Cyanobacteria/Cyanophyceae) using the phycocyanin intergenic spacer and flanking regions (cpcBA). J. Phycol. 37:810-818.
-
- Briand, E., N. Escoffier, C. Straub, M. Sabart, C. Quiblier, and J. F. Humbert. 2009. Spatiotemporal changes in the genetic diversity of a bloom-forming Microcystis aeruginosa (cyanobacteria) population. ISME J. 3:419-429. - PubMed
-
- Clement, M., D. Posada, and K. A. Crandall. 2000. TCS: a computer program to estimate gene genealogies. Mol. Ecol. 9:1657-1659. - PubMed
-
- Dittmann, E., and C. Wiegand. 2006. Cyanobacterial toxins—occurrence, biosynthesis and impact on human affairs. Mol. Nutr. Food Res. 50:7-17. - PubMed
Publication types
MeSH terms
Substances
Associated data
- Actions
- Actions
- Actions
- Actions
- Actions
- Actions
- Actions
- Actions
- Actions
- Actions
- Actions
- Actions
- Actions
- Actions
- Actions
- Actions
- Actions
- Actions
- Actions
- Actions
- Actions
- Actions
- Actions
- Actions
- Actions
- Actions
- Actions
- Actions
- Actions
- Actions
- Actions
- Actions
- Actions
- Actions
- Actions
- Actions
- Actions
- Actions
- Actions
- Actions
- Actions
- Actions
- Actions
- Actions
- Actions
- Actions
- Actions
- Actions
- Actions
- Actions
- Actions
- Actions
- Actions
- Actions
- Actions
- Actions
- Actions
- Actions
- Actions
- Actions
- Actions
- Actions
- Actions
- Actions
- Actions
- Actions
- Actions
- Actions
- Actions
- Actions
- Actions
- Actions
- Actions
- Actions
- Actions
- Actions
- Actions
- Actions
- Actions
- Actions
- Actions
- Actions
- Actions
- Actions
- Actions
- Actions
- Actions
- Actions
- Actions
- Actions
- Actions
- Actions
- Actions
- Actions
- Actions
- Actions
- Actions
- Actions
- Actions
- Actions
- Actions
- Actions
- Actions
- Actions
- Actions
- Actions
- Actions
- Actions
- Actions
- Actions
- Actions
- Actions
- Actions
- Actions
- Actions
- Actions
- Actions
- Actions
- Actions
- Actions
- Actions
- Actions
- Actions
- Actions
- Actions
- Actions
- Actions
- Actions
- Actions
- Actions
- Actions
- Actions
- Actions
- Actions
- Actions
- Actions
- Actions
- Actions
- Actions
- Actions
- Actions
- Actions
- Actions
- Actions
- Actions
- Actions
- Actions
- Actions
- Actions
- Actions
- Actions
LinkOut - more resources
Full Text Sources
Molecular Biology Databases
