Environment and vascular bed origin influence differences in endothelial transcriptional profiles of coronary and iliac arteries
- PMID: 20543076
- PMCID: PMC2944485
- DOI: 10.1152/ajpheart.00002.2010
Environment and vascular bed origin influence differences in endothelial transcriptional profiles of coronary and iliac arteries
Abstract
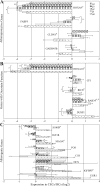
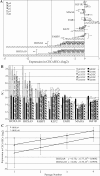
Atherosclerotic plaques tend to form in the major arteries at certain predictable locations. As these arteries vary in atherosusceptibility, interarterial differences in endothelial cell biology are of considerable interest. To explore the origin of differences observed between typical atheroprone and atheroresistant arteries, we used DNA microarrays to compare gene expression profiles of harvested porcine coronary (CECs) and iliac artery endothelial cells (IECs) grown in static culture out to passage 4. Fewer differences were observed between the transcriptional profiles of CECs and IECs in culture compared with in vivo, suggesting that most differences observed in vivo were due to distinct environmental cues in the two arteries. One-class significance of microarrays revealed that most in vivo interarterial differences disappeared in culture, as fold differences after passaging were not significant for 85% of genes identified as differentially expressed in vivo at 5% false discovery rate. However, the three homeobox genes, HOXA9, HOXA10, and HOXD3, remained underexpressed in coronary endothelium for all passages by at least nine-, eight-, and twofold, respectively. Continued differential expression, despite removal from the in vivo environment, suggests that primarily heritable or epigenetic mechanism(s) influences transcription of these three genes. Quantitative real-time polymerase chain reaction confirmed expression ratios for seven genes associated with atherogenesis and over- or underexpressed by threefold in CECs relative to IECs. The present study provides evidence that both local environment and vascular bed origin modulate gene expression in arterial endothelium. The transcriptional differences observed here may provide new insights into pathways responsible for coronary artery susceptibility.
Figures


Similar articles
-
In vivo differences between endothelial transcriptional profiles of coronary and iliac arteries revealed by microarray analysis.Am J Physiol Heart Circ Physiol. 2008 Oct;295(4):H1556-61. doi: 10.1152/ajpheart.00540.2008. Epub 2008 Aug 8. Am J Physiol Heart Circ Physiol. 2008. PMID: 18689496 Free PMC article.
-
Coronary artery endothelial transcriptome in vivo: identification of endoplasmic reticulum stress and enhanced reactive oxygen species by gene connectivity network analysis.Circ Cardiovasc Genet. 2011 Jun;4(3):243-52. doi: 10.1161/CIRCGENETICS.110.958926. Epub 2011 Apr 14. Circ Cardiovasc Genet. 2011. PMID: 21493819 Free PMC article.
-
Comparative gene expression analysis between coronary arteries and internal mammary arteries identifies a role for the TES gene in endothelial cell functions relevant to coronary artery disease.Hum Mol Genet. 2012 Mar 15;21(6):1364-73. doi: 10.1093/hmg/ddr574. Epub 2011 Dec 12. Hum Mol Genet. 2012. PMID: 22156939
-
Differential genomic changes caused by cholesterol- and PUFA-rich diets in regenerated porcine coronary endothelial cells.Physiol Genomics. 2012 May 1;44(10):551-61. doi: 10.1152/physiolgenomics.00140.2011. Epub 2012 Mar 27. Physiol Genomics. 2012. PMID: 22454453
-
Heterogeneity of endothelial cell phenotype within and amongst conduit vessels of the swine vasculature.Exp Physiol. 2012 Sep;97(9):1074-82. doi: 10.1113/expphysiol.2011.064006. Epub 2012 Apr 27. Exp Physiol. 2012. PMID: 22542613
Cited by
-
Transcriptional drifts associated with environmental changes in endothelial cells.Elife. 2023 Mar 27;12:e81370. doi: 10.7554/eLife.81370. Elife. 2023. PMID: 36971339 Free PMC article.
-
Isolation and Culture Expansion of Tumor-specific Endothelial Cells.J Vis Exp. 2015 Oct 14;(105):e53072. doi: 10.3791/53072. J Vis Exp. 2015. PMID: 26554446 Free PMC article.
-
The unique structural and functional characteristics of glomerular endothelial cell fenestrations and their potential as a therapeutic target in kidney disease.Am J Physiol Renal Physiol. 2023 Oct 1;325(4):F465-F478. doi: 10.1152/ajprenal.00036.2023. Epub 2023 Jul 20. Am J Physiol Renal Physiol. 2023. PMID: 37471420 Free PMC article. Review.
-
Gene expression differences during the heterogeneous progression of peripheral atherosclerosis in familial hypercholesterolemic swine.BMC Genomics. 2013 Jul 3;14:443. doi: 10.1186/1471-2164-14-443. BMC Genomics. 2013. PMID: 23822099 Free PMC article.
-
Influence of elastin-derived peptides on metalloprotease production in endothelial cells.Exp Ther Med. 2010 Nov;1(6):1057-1060. doi: 10.3892/etm.2010.157. Epub 2010 Sep 29. Exp Ther Med. 2010. PMID: 22993640 Free PMC article.
References
-
- Aicher A, Heeschen C, Mildner-Rihm C, Urbich C, Ihling C, Technau-Ihling K, Zeiher AM, Dimmeler S. Essential role of endothelial nitric oxide synthase for mobilization of stem and progenitor cells. Nat Med 9: 1370–1376, 2003 - PubMed
-
- Aird WC. Phenotypic heterogeneity of the endothelium. I. Structure, function, and mechanisms. Circ Res 100: 158–173, 2007 - PubMed
-
- Aird WC. Phenotypic heterogeneity of the endothelium. II. Representative vascular beds. Circ Res 100: 174–190, 2007 - PubMed
-
- Armstrong ML, Heistad DD. Animal models of atherosclerosis. Atherosclerosis 85: 15–23, 1990 - PubMed
Publication types
MeSH terms
Grants and funding
LinkOut - more resources
Full Text Sources
Research Materials

