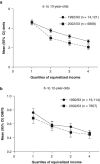
Trend of income-related inequality of child oral health in Australia
- PMID: 20543094
- PMCID: PMC3318073
- DOI: 10.1177/0022034510371280
Trend of income-related inequality of child oral health in Australia
Abstract
It is important that we monitor socio-economic inequality in health. Inequality in child oral health has been expected to widen because of widening socio-economic inequality. This study aimed to evaluate trends in income-related inequality in caries experience of Australian children. Cross-sectional studies in 1992/93 and 2002/03 collected data on deciduous caries experience of 5- to 10-year-olds and permanent caries experience of 6- to 12-year-olds. Household composition and income was used to calculate quartiles of equivalized income. Slope Index of Inequality (SII), Concentration Index (CI), and regression-based rate ratios were used to quantify income-related inequality and to evaluate trends. Income-related inequality in caries experience was evident regardless of time and dentition. The three indicators of inequality indicate a significant increase in income-related inequality in child deciduous caries experience during the decade. The income inequality in permanent caries experience did not change significantly. Income inequalities increased in deciduous teeth, but not in permanent teeth, among Australian children.
Figures


References
-
- AIHW (2007). Profile of nutritional status of children and adolescents. Cat. No. PHE 89 Canberra: Australian Institute of Health and Welfare
-
- Antunes JL, Jahn GM, de Camargo MA. (2005). Increasing inequalities in the distribution of dental caries in the Brazilian context in Finland. Community Dent Health 22:94-100 - PubMed
-
- DHHS (2000). Oral health in America: a report of the Surgeon General. Rockville, MD: US Department of Health and Human Services
Publication types
MeSH terms
LinkOut - more resources
Full Text Sources
Medical

