. 2010 Jul 15;185(2):1311-20.
doi: 10.4049/jimmunol.0902238. Epub 2010 Jun 11.

An IL-2 paradox: blocking CD25 on T cells induces IL-2-driven activation of CD56(bright) NK cells

Affiliations

An IL-2 paradox: blocking CD25 on T cells induces IL-2-driven activation of CD56(bright) NK cells

Jayne F Martin et al. J Immunol. .

Abstract

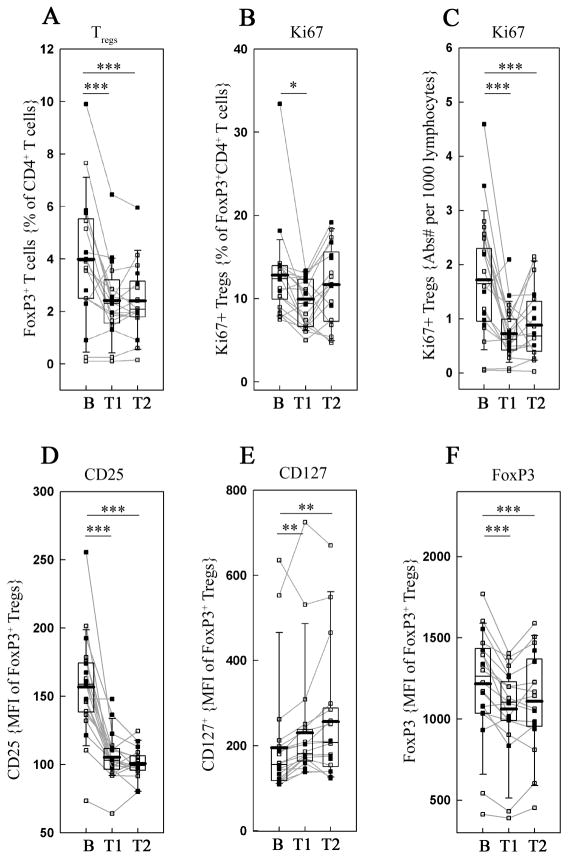
Daclizumab (Dac), an Ab against the IL-2R alpha-chain, inhibits brain inflammation in patients with multiple sclerosis, while expanding CD56(bright) immunoregulatory NK cells in vivo. We hypothesized that this unexpected expansion is paradoxically IL-2 driven; caused by the increased availability of T cell-derived IL-2 for NK cell signaling. To this end, we performed ex vivo functional analyses of CD56(bright) NK cells and T cells from patients in clinical trials with Dac. We developed in vitro models to investigate mechanisms for ex vivo observations. We observed that Dac treatment caused decreased numbers and proliferation of FoxP3(+) T regulatory cells (Tregs), a model T cell population known to be dependent on IL-2 for proliferation and survival. As anticipated, Dac therapy inhibited IL-2 signaling in all T cells; however, we also observed functional adaptation of T cells to low IL-2 signal in vivo, characterized by the concomitant enhancement of IL-7 signaling on all T cells and parallel increase of CD127 expression by Tregs. In contrast, IL-2 signaling on CD56(bright) NK cells was not inhibited by Dac and their in vivo proliferation and cytotoxicity actually increased. Mechanistic studies indicated that the activation of CD56(bright) NK cells was likely IL-2 driven, as low doses of IL-2, but not IL-15, mimicked this activation in vitro. Our study provides insight into the role that IL-2 and CD25 play in functional regulation of two important immunoregulatory cell populations in humans: FoxP3(+) Tregs and CD56(bright) NK cells.


Figures

Figure 1
Figure 1. Ex vivo CD56bright NK cell proliferation
Cryopreserved PBMCs were stained prior to permeabilization for NK cell marker CD56, T cell marker CD3 (A) and following permeabilization, stained for intranuclear proliferation marker Ki67 (B) at baseline and treatment time points (B, T1 & T2). Ki67 gating was set individually on CD56bright NK cells only. Both proportion (left panel) and absolute numbers of proliferating CD56bright NK cells per 1000 gated lymphocytes (right panel) are depicted. Patients from the monotherapy trial are indicated by open squares and patients from the combination therapy trial are indicated by black squares. Means are marked with a thick black line. Raw data FACS plots are taken from a representative patient.
Figure 2
Figure 2. Ex vivo Treg proliferation and CD127 expression
Cryopreserved PBMCs were stained for intranuclear transcription factor FoxP3 (A) and proliferation marker Ki67 (B&C) at baseline and treatment time points (B, T1 & T2). Prior to permeabilization, they were stained for CD25 (D) and CD127 (E) expression, displayed here by mean fluorescence intensity (MFI) of the FoxP3+ Treg population. Furthermore, the MFI of Foxp3 expression on CD4+ CD25+ Tregs is displayed (F) for baseline and subsequent treatment time points. Patients from the monotherapy trial are indicated by open squares and patients from the combination therapy trial are indicated by black squares. * denotes p<0.05, ** denotes p<0.01, *** denotes p<0.001 and means are marked with a thick black line. FACS plots are taken from a representative patient.
Figure 3
Figure 3. Ex vivo IL-2 and IL-7 signaling
Cryopreserved PBMCs from baseline and therapy time points (B, T1 & T2) were thawed and rested for an hour at 37°C in X-vivo media. They were subsequently pulsed with IL-2 (A&C) or IL-7 (B) for 10 minutes and then fixed in formaldehyde, washed, and permeabilized with methanol. They were then stained for surface markers and phosphorylated STAT5 (pSTAT5). Gating was set from control wells pulsed with X-vivo media lacking additional cytokines. For CD56bright NK cells (C), both the proportion (left panel) and absolute numbers (calculated per 1000 lymphocytes; right panel) of pSTAT5+ cells are displayed. Again, patients from the monotherapy trial are indicated by open squares and patients from the combination therapy trial are indicated by black squares. Means are marked with a thick black line. Raw data FACS plots are taken from a representative patient.
Figure 4
Figure 4. In vitro NK proliferation
(A) IL-2 consumption by T cells was measured by ELISA from supernatants of activated T cells cultured with either daclizumab (Dac) or an anti-CD25 control Ab which does not bind to the IL-2 binding tac epitope (M-A251): T cells were polyclonally stimulated for 3 days, extensively washed and reseeded in equal numbers with exogenously added IL-2 (20 IU/ml) and Dac or M-A251 Ab (10μg/ml each). Supernatants were collected in 24–48h and the amount of IL-2 remaining was measured by ELISA. Samples were taken from 4 patients (2 patients with purified (negatively-selected) T cells and 2 with NK-depleted PBMC). (B) CFSE dilution of NK cells was measured after 5 days in culture with increasing ratios of daclizumab-treated CD3/CD28 stimulated T cells (n=4). (C & D) Transwell experiments: Negatively-selected T cells (or NK-depleted PBMC) were polyclonally activated for 24–72h and 1×10⁶ activated T cells were seeded in the lower compartment of transwells in the presence of control Ab M-A251, daclizumab (Dac), IL-2-neutralizing Ab (α-IL-2) or 20IU IL-2. Autologous NK cells were negatively selected from either fresh or cryopreserved apheresis samples 24 hours before co-culture with activated T cells, they were CFSE stained and rested overnight before adding 1×10⁵ NK cells into the transwell inserts. In 3–5 days, NK cell proliferation was assessed by CFSE dilution and their absolute numbers were proportionally enumerated between conditions by normalizing per 1000 fluorescent beads added prior to acquisition by flow cytometry. Because we observed that activated NK cells were able to migrate through 3μm pores in the transwell inserts to the T cell compartment, we present total cultures from both the upper compartment of the transwell (top row) and the lower compartment of the transwell (bottom row): (C) Representative raw data FACS plots (with numbers indicating absolute numbers of CD56bright (red) and CD56dim (blue) NK cells) and (D) enumeration of proportion and absolute numbers of proliferating CD56bright NK cells. Data are representative of 4 independent patients/experiments (2 for both purified T cells and 2 for NK-depleted PBMCs). (E & F) Supernatant-transfer experiments: Negatively-selected T cells were polyclonally activated for 24–72h in the presence/absence of control Ab M-A251, daclizumab or IL-2-neutralizing Ab (α-IL-2). Supernatant from these cultures were collected 24–48 hours post-activation and cryopreserved until testing. NK cells were isolated by negative selection from fresh or cryopreserved apheresis samples, CFSE stained and cultured for 3 days with collected supernatant from activated T cells: (E) FACS plots representative of NK cell proliferation (absolute numbers of CD56bright and CD56dim NK cells are depicted in the gates) and (F) enumeration of proportion and absolute numbers of proliferating CD56bright NK cells. Data are representative of 2 independent patients/experiments. * denotes p<0.05, *** denotes p<0.001.
Figure 5
Figure 5. Ex vivo cytotoxicity
Cryopreserved PBMCs were thawed and incubated with GFP+ K562 target cells and CD107a PE-Cy5 Ab overnight at 37°C. Co-cultures were stained the following day for CD3/CD56 and analyzed for (A) killing and (B) CD107a incorporation indicative of degranulation. Killing was measured as the percentage of K562 cells that were lost based on a condition with target cells only (A, top left). CD107a gating was set with conditions lacking target cells. Left panels summarize group data while right panels correspond to a representative example. (C) The absolute numbers of degranulating (CD107a+) CD56bright and CD56dim NK cells per 1000 lymphocytes are depicted for each time point (B, T1 and T2). Patients from the monotherapy trial are indicated by open squares and patients from the combination therapy trial are indicated by black squares. (D) The absolute numbers of degranulating CD56bright NK cells are positively correlated with the target killing using Spearman’s correlation. * denotes p<0.05, ** denotes p<0.01 and *** denotes p<0.001. Means are marked with a thick black line.
Figure 6
Figure 6. IL-2 enhances in vitro cytotoxicity
NK cells were negatively isolated from healthy donor PBMCs and stimulated overnight with IL-2 (A–C) or IL-15 (D–F). They were measured for perforin expression both before (A&D, left panels) and after (A&D, right panels) culture with MHC-I deficient target K562 cells. Loss of perforin mean fluorescence intensity (MFI; Δ +/− target) was calculated as difference between perforin MFI measured in CD56bright NK cells cultured without- and with the targets. CD107a PE-Cy5 Ab was added prior to adding targets and 4 hours later the cultures were analyzed by flow cytometry for degranulation of gated CD56bright NK cells (B&E) and K562 killing (C&F). CD107a gating was set with conditions lacking target cells. Killing was measured as the percentage of K562 cells that were lost based on a condition with target cells only. * denotes p<0.05 and ** denotes p<0.01.

References

    1. Caligiuri MA. Human natural killer cells. Blood. 2008;112:461–469. - PMC - PubMed
    1. Cooper MA, Fehniger TA, Turner SC, Chen KS, Ghaheri BA, Ghayur T, Carson WE, Caligiuri MA. Human natural killer cells: a unique innate immunoregulatory role for the CD56 (bright) subset. Blood. 2001;97:3146–3151. - PubMed
    1. Bratke K, Kuepper M, Bade B, Virchow JC, Jr, Luttmann W. Differential expression of human granzymes A, B, and K in natural killer cells and during CD8+ T cell differentiation in peripheral blood. Eur J Immunol. 2005;35:2608–2616. - PubMed
    1. Della Chiesa M, Vitale M, Carlomagno S, Ferlazzo G, Moretta L, Moretta A. The natural killer cell-mediated killing of autologous dendritic cells is confined to a cell subset expressing CD94/NKG2A, but lacking inhibitory killer Ig-like receptors. Eur J Immunol. 2003;33:1657–1666. - PubMed
    1. Bielekova B, Catalfamo M, Reichert-Scrivner S, Packer A, Cerna M, Waldmann TA, McFarland H, Henkart PA, Martin R. Regulatory CD56bright natural killer cells mediate immunomodulatory effects of IL-2R{alpha}-targeted therapy (daclizumab) in multiple sclerosis. PNAS. 2006;103:5941–5946. - PMC - PubMed

Publication types

MeSH terms