. 2010 Jul 1;185(1):99-109.
doi: 10.4049/jimmunol.0903312. Epub 2010 Jun 11.

The adaptor molecule Act1 regulates BAFF responsiveness and self-reactive B cell selection during transitional B cell maturation

Affiliations

The adaptor molecule Act1 regulates BAFF responsiveness and self-reactive B cell selection during transitional B cell maturation

Natalia V Giltiay et al. J Immunol. .

Abstract

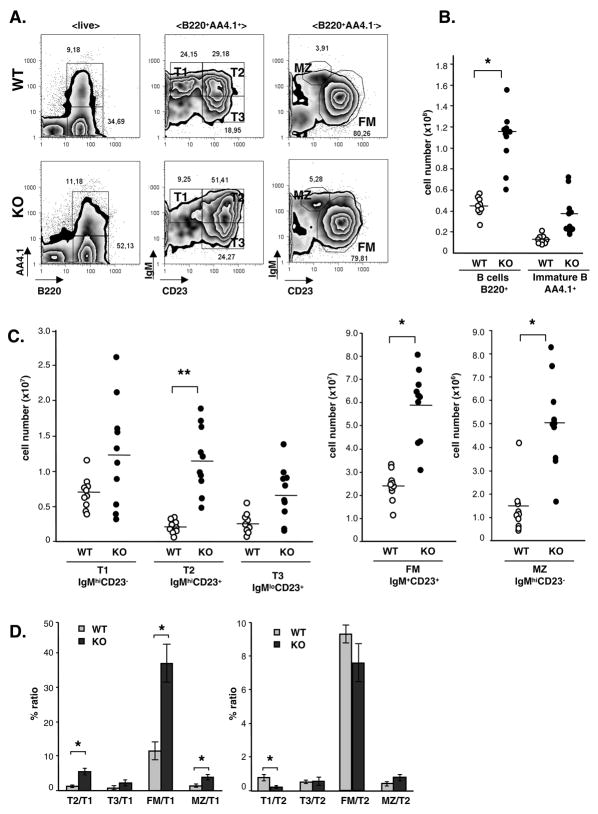
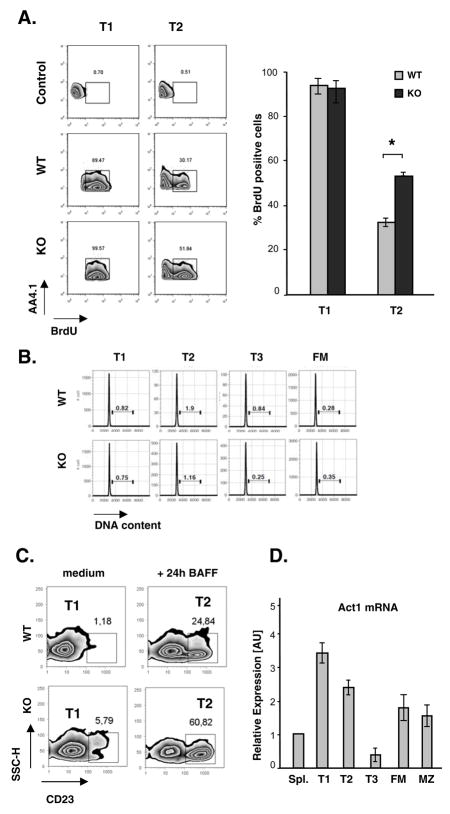
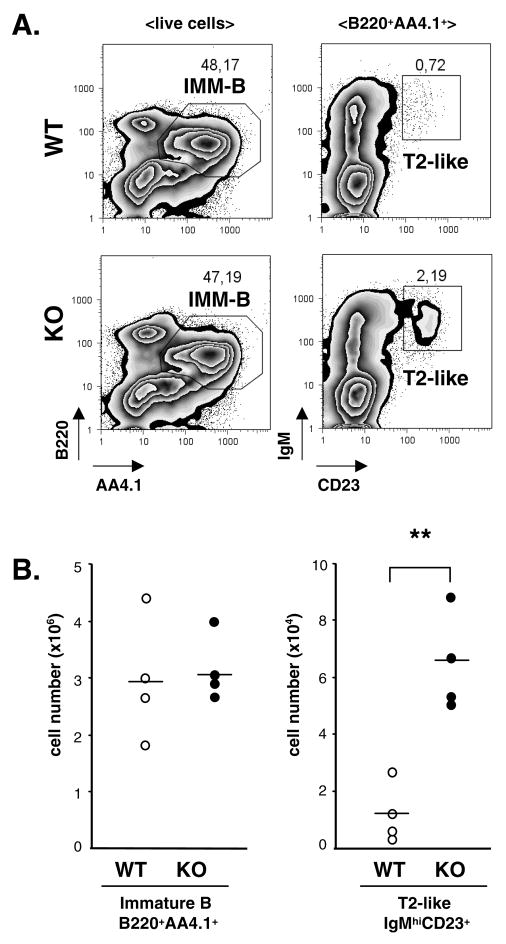
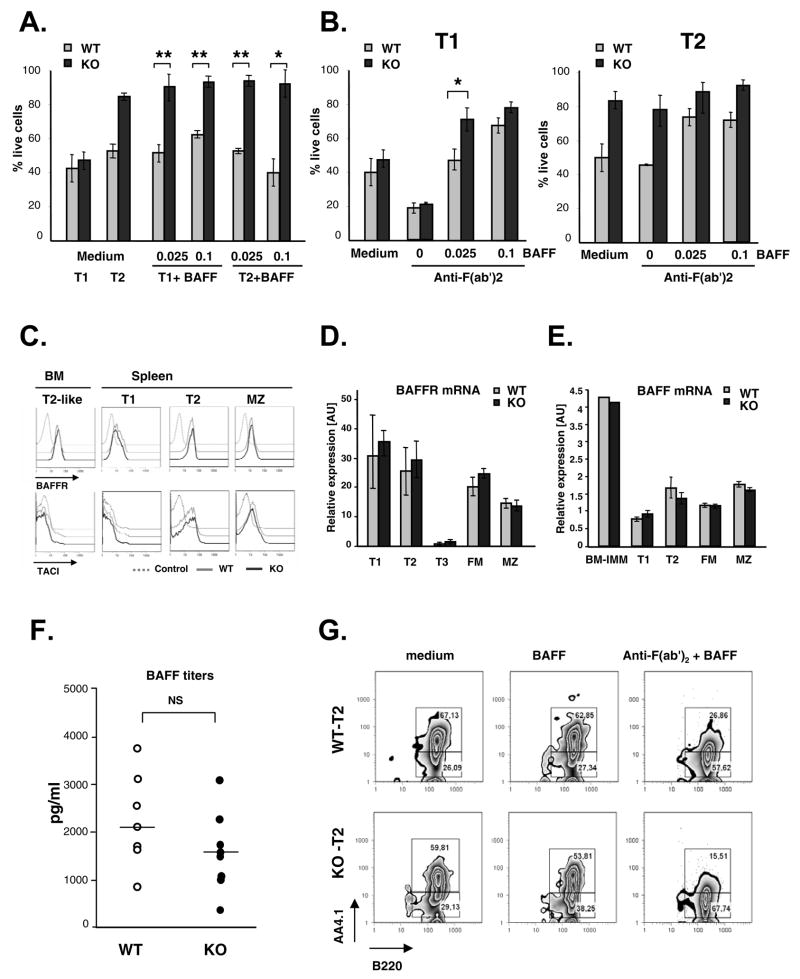
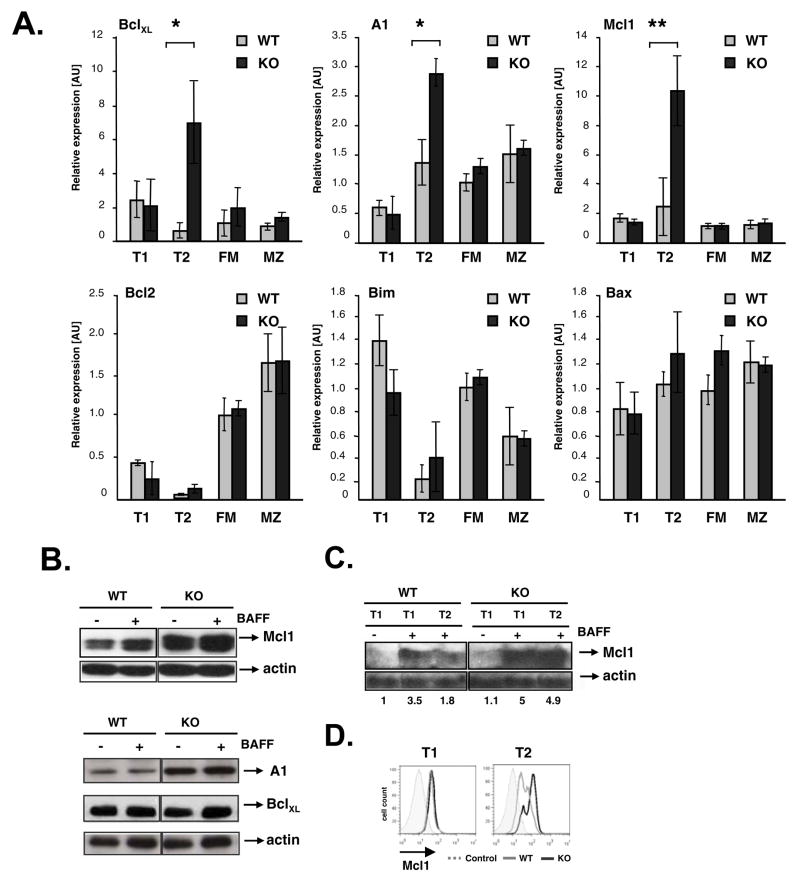
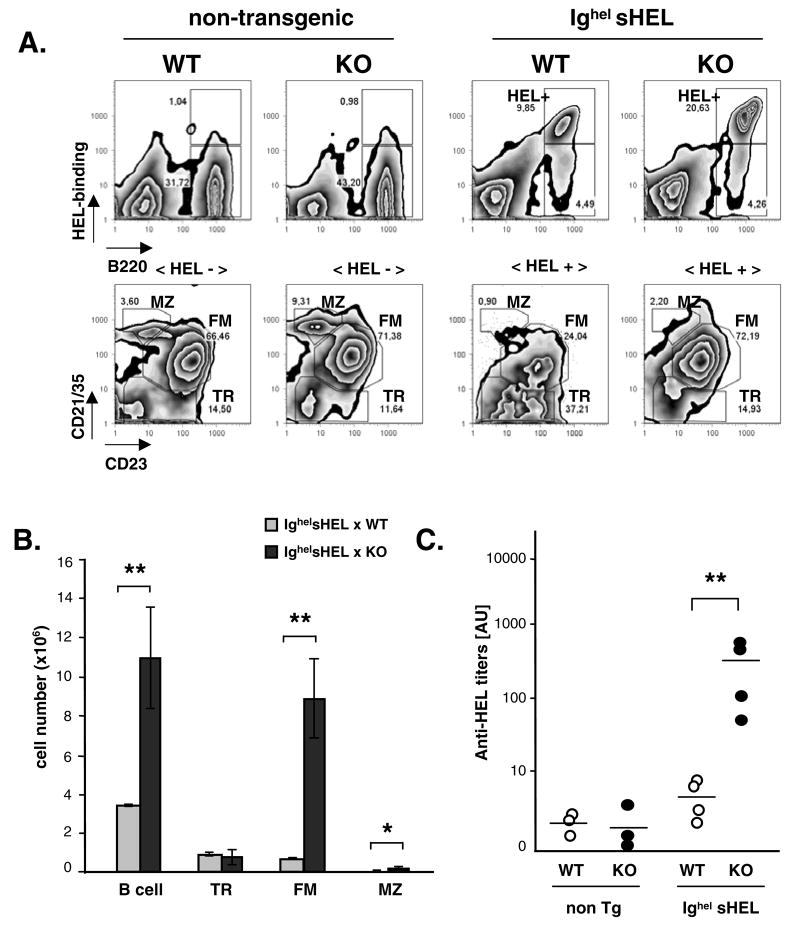
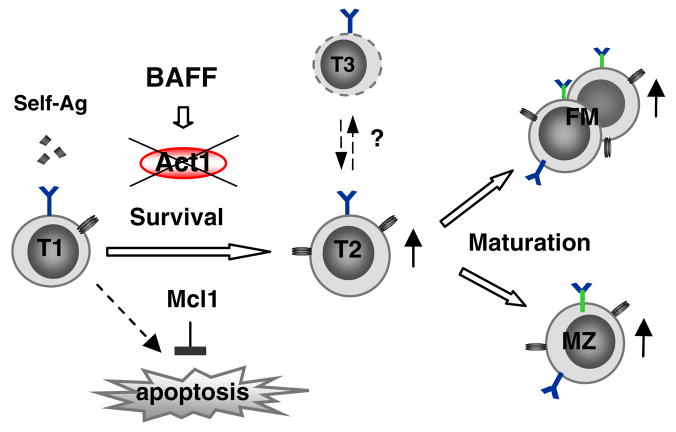
The transitional stage is a key check-point for elimination of autoreactive B cells in the periphery. This selection process requires fine regulation of signals received through BCR and B cell activating factor (BAFF) receptor. We previously identified the adaptor molecule Act1 as a negative regulator of BAFF-mediated signaling. Deficiency of Act1 in mice results in peripheral B cell hyperplasia and development of autoimmunity. In this study, we demonstrate that Act1 plays a critical role in the regulation of transitional B cell survival and maturation. We found that the ratio of late-transitional (T2) to early-transitional (T1) cells was increased in spleens from Act1-deficient mice. Moreover, BAFF stimulation induced better T1 cell survival and promoted more efficient maturation of T1 cells into T2 cells ex vivo in the absence of Act1. BAFF stimulation induced higher levels of the anti-apoptotic Bcl-2 member Mc1-l in Act1-deficient T1 cells than in wild-type control cells, suggesting that Mcl-1 might be one of the key effector molecules for BAFF-mediated survival of the Act1-deficient transitional B cells. Importantly, costimulation with BAFF was able to rescue Act1-deficient T1 cells from BCR-induced apoptosis more effectively than Act1-sufficient T1 B cells. Finally, by using hen egg lysozyme double transgenic mice, we demonstrated that Act1 deficiency can promote the maturation of Ag-specific autoreactive B cells. Taken together, our results suggest that the transitional stage is a critical point of action of Act1 in the elimination of autoreactive B cells and in the regulation of peripheral B cell homeostasis.


Conflict of interest statement

DISCLOSRES

The authors declare no financial or commercial conflicts of interests.

Figures

Figure 1
Figure 1. Alterations in transitional B cell subsets in Act1-deficient mice
A. Representative FACS analysis of splenic cell populations from 8 weeks-old Balb/c Act1-deficient and wt control mice. Cells were harvested and stained with anti-B220, AA4.1, CD23 and IgM Abs. B and C. Absolute number of total B (B220+), immature (B220+AA4.1+), T1 (B220+AA4.1+IgMhiCD23lo), T2 (B220+AA4.1+IgMhiCD23hi) and T3 (B220+AA4.1+IgMloCD23hi) cell subsets in the spleen. The cell number was calculated based on the total cell number per spleen. Data represents the cell number for individual mice (n= 10). Lines represent the mean values for each genotype. D. Graphs represent the ratio between individual B cell subsets to T1 or T2 cells in wt and Act1-deficient mice. Calculations were made based on the percentage of each cell subset out of the total B220+ cell in each individual mouse. *, P< 0.05 and **, P<0,001
Figure 2
Figure 2. Accelerated T1 to T2 transition in the absence of Act1
A. Detection of BrdU incorporation in T1 and T2/T3 B cell subsets from wt and Act1-deficient mice after continues in vivo BrdU labeling. Splenocytes from control mice and mice given BrdU injections were stained with AA4.1, CD23 and IgM Abs. 50,000 events/sample were analyzed and the results represent the percentage of BrdU positive cells within the T1 (IgM+AA4.1+CD23) and T2/T3 (IgM+/−AA4.1+CD23+) sub-populations. Data represents the mean ± SD from three independent experiments. B. DNA content analysis of T1, T2, T3 and FM cell sub-populations from wt and Act1-deficient mice. 50,000 cells from each population were stained for surface markers as described, fixed, permeabilized and stained with DAPI. Graphs represent DAPI profiles of the cell populations and gates show the fraction of cells within G2/M phase. C. Ex vivo maturation of T1 cells upon BAFF stimulation. T1 cells from wt and Act1 deficient mice (n = 8 mice/group) were isolated by cell sorting. Cells were grown for 24h in RPMI medium in the absence or presence of BAFF (0.1μg/ml). Cells were stained for CD23 surface expression and analyzed by FACS. The numbers refer to the percentage of CD23+ cells within the gated live cell population. Data is representative for two independent experiments. D. Analysis of the expression levels of Act1 mRNA in splenic B-cell subsets. Splenocytes from 8–10 weeks old wt Balb/c mice were FACS-sorted into T1 (B220+IgMhiAA4.1+CD23), T2 (B220+IgMhiAA4.1+CD23+), T3 (B220+IgMloAA4.1+ CD23+), FM (B220+IgMhiCD23+) and MZ (B220+IgMhiCD23) subsets. The relative expression level of Act1 mRNA in different cell subsets is shown in relative units, where 1 unit = the level of Act1 mRNA in unsorted splenocytes. Each cell population was sorted from 4 individual mice.
Figure 3
Figure 3. Increased numbers of T2-like cells in BM of Act1-deficient mice
A. Representative FACS analysis of B cell populations in the BM of 8-week old wt control and Act1-deficient mice. (B) Absolute numbers immature B (B220+AA4.1+) and T2-like (B220+AA4.1+IgMhiCD23hi) cells in the BM. Data represents the cell number for individual mice (n= 4). Lines represent the mean values for each genotype. ** p < 0.01
Figure 4
Figure 4. Enhanced survival of Act1-deficient T1 cells upon ex vivo BAFF treatment and BCR cross-linking
A. Splenocytes from wt control and Act1-deficient mice (3 mice/group) were stained as described in Materials and Methods and T1 (B220+IgMhiAA4.1+CD23) and T2 (B220+IgMhiAA4.1+CD23+) cells were isolated by cell sorting. Cells were incubated in medium in the absence or presence of increasing doses (0.025 and 0.1 μg/ml) of BAFF. Cell survival rates were measured 24h after the initial treatment by 7AAD staining. Shown are the percentages of 7AAD-negative cells within different cell populations. Data represents the mean ± SD from three independent experiments. B. Sorted T1 cells or T2 cells from wt and Act1-deficient mice were treated with anti-IgM F(ab′)2 alone or in the presence of BAFF (0.025 or 0.1 μg/ml). Graphs show the percentage live cells present after 24h of treatment. Data represents the mean ± SD from three independent experiments. C. BAFFR and TACI are equally expressed on B cell subsets from wt and Act1-deficient mice. FACS analysis of BAFFR and TACI expression levels in BM T2-like cell and splenic T1, T2 and MZ cell subsets. D. Analysis of the expression levels of BAFFR mRNA in splenic B-cell subsets. Splenocytes from 8–10 weeks old wt and Act1-deficient mice were FACS-sorted into T1 (B220+IgMhiAA4.1+CD23), T2 (B220+IgMhiAA4.1+CD23+), T3 (B220+IgMloAA4.1+ CD23+), FM (B220+IgMhiCD23+) and MZ (B220+IgMhiCD23+) subsets. The relative expression level of BAFFR in different cell subsets was calculated based on the expression level in unsorted splenocytes (1 AU). Data represents the mean ± SD. Each cell population was sorted from 4 mice from each genotype. E. Expression levels of BAFF mRNA in different B-cell subsets, including BM immature (MB-IMM) B cells, and splenic T1, T2, MZ, FM cells. The relative expression level of BAFF was calculated based on the expression in wt FM splenocytes (1 AU). Data represents the mean ± SD. Each cell population was sorted from 4 mice from each group. F. BAFF titers in the sera from wt and Act1-deficient mice were analyzed by ELISA. The concentration of BAFF for each sample was calculated according to a standard curve. Each dot represents an individual mouse. Lines represent mean values for each group. G. In vitro maturation of T2 cells upon BCR cross-linking and BAFF stimulation. Cultures were initiated using sorted T2 cells, which were grown in the presence of 0.1 μg/ml of BAFF and 10 μg/ml anti-IgM F(ab′)2 antibody. The expression of B220 and AA4.1 was analyzed after 48h of treatment. Shown are representative FACS plots of gated live cells. The numbers represent the mean of induced loss (Δ%) of AA4.1 on T2 cells cultured without BAFF, BAFF alone or BAFF plus anti-IgM F(ab′)2 from three separate experiments.
Figure 5
Figure 5. Up-regulation of pro-survival genes in Act1-deficient mice during transitional stage
A. Relative expression level of Bcl2-family members Bclxl, A1, Mcl1, Bcl2, Bim and Bax in different splenic B cell subsets, sorted from 8-week old wt control and Act1-deficient mice. Data represents the average fold change relative to the wt FM cells ± SD. Each cell population was isolated from 4 individual mice from each group. B. Western Blot analysis of Mcl1, A1 and Bclxl expression in total splenic B cells. Cells were treated with 0.5 μg/ml BAFF for 24h. C. Western Blot analysis of the Mcl1 expression in sorted T1 and T2 cells in response to BAFF stimulation. Cells were sorted as described above and treated with 0.5 μg/ml BAFF for 24h. Beta-actin was used as a loading control. Numbers represent normalized expression levels of Mcl-1. Results are representative for three independent experiments. D. Mcl-1 expression in T1 and T2 B cell populations assessed by intracellular FACS staining. Splenic B cells from wt-control and Act1-deficient mice were isolated and stain for AA4.1, IgM and CD23 cell-surface markers. Cells were permeabilization and stained with polyclonal anti-Mcl-1 Ab. Normal rabbit IgG was used as isotype control.
Figure 6
Figure 6. Act1 deficiency increases the B cell number in HEL-double transgenic mice and promotes the maturation of HEL-specific autoreactive B cells
Spleens from wt and Act1-deficient IghelsHEL mice were harvested and cells were stained as described in Materials and Methods. A. Representative FACS analysis of cell subsets from wt control and Act1-deficient IghelsHEL mice showing the proportion of HEL-binding cells within the B220+ cells (upper panel) and CD21/35 and CD23 profiles of gated HEL+B220+ B cells (lower panel). Gated populations are: T1-T3 (transitional) (CD21/35loCD23lo/hi), FM (CD21/35int CD23hi) and MZ (CD21/35hiCD23lo) B. Absolute numbers of B cells (B220+), T1-T3, FM and MZ cells in wt and Act1 deficient IghelsHEL mice. Data represents the mean ± SD from three individual mice per group. Numbers of wt MZ B cells equals 3.5 × 10⁴, while Act1−/− MZ B cells equals 2 × 10⁵ cells. C. Sera from wt control and Act1-deficient sHEL.IgHEL mice were analyzed for reactivity to HEL by ELISA. The level of reactivity for each sample was normalized to that of a known wt non-transgenic control sample. Each dotes represents an individual mouse. Lines represent mean values for each genotype. *, P< 0.05 and **, P<0,001.
Figure 7
Figure 7. Transitional stage represents a critical point of action for Act1 in regulation of peripheral B cell homeostasis and elimination of autoreactive cells – graph representation
The survival of T1 cells depends on signals received through their B cell antigen receptor (BCR) and pro-survival signals delivered by BAFF. In normal conditions big portion of the T1 undergo apoptosis which ensures the elimination of potentially autoreactive cells. Act1 deficiency results in excessive BAFFR signaling and up-regulation of anti-apoptotic molecules, such as Mcl1, which results in increased T1 and T2 cell survival and accelerates their maturation. As a result, Act1 deficient mice show increased T2 to T1 ratio and substantial accumulation of T2 cells in the spleen. T2 cells can further mature and enter the FM or MZ cell subsets. Thus Act1 deficiency results in accumulation of potentially autoreactive FM and MZ cells in the periphery.

Similar articles

Cited by

References

    1. Basten A, Brink R, Peake P, Adams E, Crosbie J, Hartley S, Goodnow CC. Self Tolerance in the B-Cell Repertoire. Immunological Reviews. 1991;122:5–19. - PubMed
    1. Shlomchik MJ. Sites and stages of autoreactive B cell activation and regulation. Immunity. 2008;28:18–28. - PubMed
    1. Hardy RR, Li YS, Allman D, Asano M, Gui M, Hayakawa K. B-cell commitment, development and selection. Immunological Reviews. 2000;175:23–32. - PubMed
    1. Monroe JG, Bannish G, Fuentes-Panana EM, King LB, Sandel PC, Chung J, Sater R. Positive and negative selection during B lymphocyte development. Immunologic Research. 2003;27:427–442. - PubMed
    1. Hardy RR, Hayakawa K, Parks DR, Herzenberg LA, Herzenberg LA. Murine B-Cell Differentiation Lineages. Journal of Experimental Medicine. 1984;159:1169–1188. - PMC - PubMed

MeSH terms