. 2010 Jul 20;107(29):12747-54.
doi: 10.1073/pnas.1002057107. Epub 2010 Jun 11.

B-cell signaling networks reveal a negative prognostic human lymphoma cell subset that emerges during tumor progression

Affiliations

B-cell signaling networks reveal a negative prognostic human lymphoma cell subset that emerges during tumor progression

Jonathan M Irish et al. Proc Natl Acad Sci U S A. .

Abstract

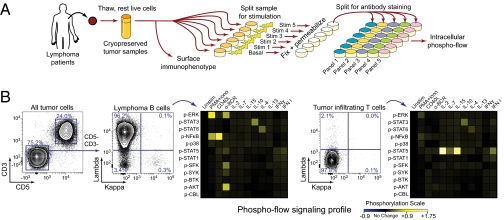
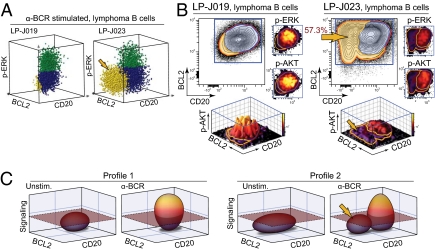
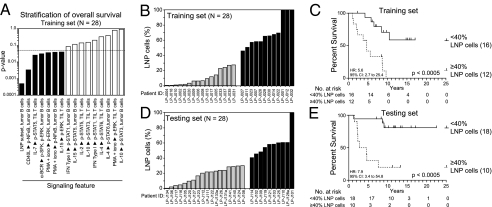
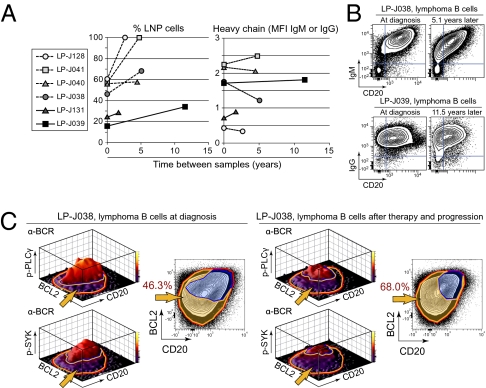
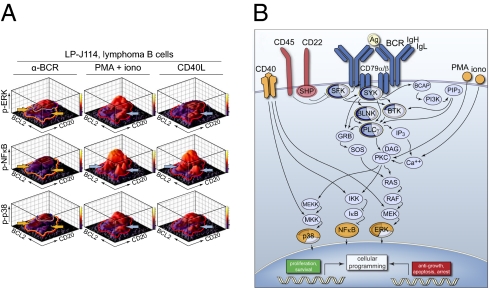
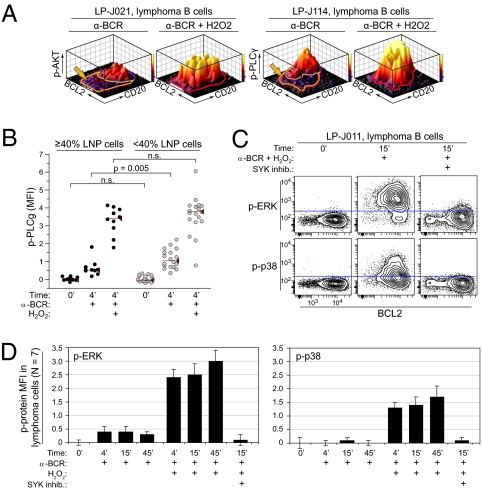
Human tumors contain populations of both cancerous and host immune cells whose malignant signaling interactions may define each patient's disease trajectory. We used multiplexed phospho-flow cytometry to profile single cells within human follicular lymphoma tumors and discovered a subpopulation of lymphoma cells with impaired B cell antigen receptor (BCR) signaling. The abundance of BCR-insensitive cells in each tumor negatively correlated with overall patient survival. These lymphoma negative prognostic (LNP) cells increased as tumors relapsed following chemotherapy. Loss of antigen receptor expression did not explain the absence of BCR signaling in LNP tumor cells, and other signaling responses were intact in these cells. Furthermore, BCR signaling responses could be reactivated in LNP cells, indicating that BCR signaling is not missing but rather specifically suppressed. LNP cells were also associated with changes to signaling interactions in the tumor microenvironment. Lower IL-7 signaling in tumor infiltrating T cells was observed in tumors with high LNP cell counts. The strength of signaling through T cell mediator of B cell function CD40 also stratified patient survival, particularly for those whose tumors contained few LNP cells. Thus, analysis of cell-cell interactions in heterogeneous primary tumors using signaling network profiles can identify and mechanistically define new populations of rare and clinically significant cells. Both the existence of these LNP cells and their aberrant signaling profiles provide targets for new therapies for follicular lymphoma.


Conflict of interest statement

The authors declare no conflict of interest.

Figures

Fig. 1.
Fig. 1.
Signaling profiles of FL B cells and tumor-infiltrating T cells. (A) An outline of the phospho-flow assay is shown. A detailed protocol is included in SI Materials and Methods. (B) Contour plots show gating for CD3+ CD5+ tumor-infiltrating T cells and CD3 CD5 lymphoma B cells. Lymphoma B cells were restricted to one Ig heavy and light chain isotype (here, lambda+). Signaling at 12 phospho-proteins was measured following stimulation conditions regulating B and T cells.
Fig. 2.
Fig. 2.
Identification of a lymphoma cell subpopulation. (A) 3D plots of cells measured by flow cytometry show BCL2, CD20, and p-ERK following α-BCR in 4,000 lymphoma B cells from two FL tumors (LP-J019 and LP-J023). (B) Cell number (contour plots) and median ERK or AKT phosphorylation following α-BCR (mountain plots) was compared across BCL2 and CD20 in lymphoma B cells from LP-J019 and LP-J023. Flow cytometry plots highlighted a subpopulation of cells within LP-J023 that did not phosphorylate AKT or ERK following α-BCR (gold arrow). (C) Models summarize two common FL signaling profiles.
Fig. 3.
Fig. 3.
Presence of LNP cells at diagnosis stratifies overall survival. (A) Significance tests for stratification of overall survival in the training set (n = 28) are shown for all FL signaling features. (B) LNP cells were quantified as a percentage of the lymphoma B cells in a training set of 28 FL tumor specimens taken before any therapy (SI Materials and Methods). (C) Overall survival of patients whose tumors contained at least 40% LNP cells and fewer than 40% LNP cells was compared in the training set and found to be significantly lower in the group with at least 40% LNP cells. (D) The LNP cell population was quantified in an independent, balanced testing set of FL patients. (E) The testing set validated the finding from B that patients whose tumor contained at least 40% LNP cells had inferior overall survival. Patients in the training and testing sets were treated with uniform initial chemotherapy.
Fig. 4.
Fig. 4.
BCR-insensitive LNP cells increase in abundance after therapy and progression. (A) Percent LNP cells and expression of Ig heavy chain was examined over time in paired samples. Four samples contained at least 40% LNP cells before therapy (dashed lines). (B) Expression of tumor isotype heavy chain and CD20 is shown for samples taken before therapy and after therapy for two patients from A. (C) Changes in the signaling profile of patient LP-J039 over time are shown with flow cytometry contour plots and mountain plots that compare PLCγ and SYK phosphorylation across BCL2 and CD20 following α-BCR stimulation.
Fig. 5.
Fig. 5.
Signaling proximal to the antigen receptor is specifically impaired in LNP cells. (A) Flow cytometry mountain plots compare phosphorylation of ERK, NF-κB, and p38 across BCL2 and CD20 following α-BCR, PMA + iono, and CD40L. LNP cells (gold arrows), by definition, did not display phosphorylation following α-BCR. Following stimulation with PMA + iono or CD40L, phosphorylation of the same BCR pathway proteins was measured in LNP cells. (B) A signaling network model graphs the results for all measured phospho-proteins. Pie shading indicates the percentage of lymphoma B cells in which phosphorylation of that protein was observed following α-BCR (blue) or PMA + iono or CD40L (orange).
Fig. 6.
Fig. 6.
Impaired BCR signaling in LNP cells is reversed by phosphatase inhibition. (A) Mountain flow cytometry plots compare phosphorylation of AKT and PLCγ across BCL2 and CD20 within lymphoma B cells from two tumors that contained LNP cells. Cells were stimulated with α-BCR alone or by α-BCR + H2O2. (B) Median basal and BCR-mediated phosphorylation of PLCγ was measured in all lymphoma B cells from patient samples with and without at least 40% LNP cells. No significant difference in basal signaling was observed. Following α-BCR, samples containing at least 40% LNP cells showed significantly lower phosphorylation of PLCγ (P = 0.005). This difference between patient groups was eliminated when samples were stimulated by α-BCR + H2O2. (C) Contour plots compare phosphorylation of ERK and p38 and expression of BCL2 in lymphoma B cells in the unstimulated basal state, following α-BCR + H2O2, and following 30 min of preincubation with SYK inhibitor R406 before α-BCR + H2O2 stimulation (LP-J011). R406 was used at 2.5 μM to block signaling induced by α-BCR + H2O2 and demonstrate that H2O2 specifically potentiated SYK dependent BCR-mediated signaling. (D) Median fluorescence intensity of phosphorylated ERK and phosphorylated p38 is shown for lymphoma B cells from seven cases of FL. Signaling was measured at 4, 15, and 45 min following α-BCR, α-BCR + H2O2, and α-BCR + H2O2 + R406, as in C.

Similar articles

Cited by

References

    1. Irish JM, et al. Single cell profiling of potentiated phospho-protein networks in cancer cells. Cell. 2004;118:217–228. - PubMed
    1. Kotecha N, et al. Single-cell profiling identifies aberrant STAT5 activation in myeloid malignancies with specific clinical and biologic correlates. Cancer Cell. 2008;14:335–343. - PMC - PubMed
    1. Gupta PB, Chaffer CL, Weinberg RA. Cancer stem cells: Mirage or reality? Nat Med. 2009;15:1010–1012. - PubMed
    1. Reya T, Morrison SJ, Clarke MF, Weissman IL. Stem cells, cancer, and cancer stem cells. Nature. 2001;414:105–111. - PubMed
    1. Horning SJ, Rosenberg SA. The natural history of initially untreated low-grade non-Hodgkin's lymphomas. N Engl J Med. 1984;311:1471–1475. - PubMed

Publication types

MeSH terms