. 2010 Jul;11(7):635-43.
doi: 10.1038/ni.1891. Epub 2010 Jun 13.

A global network of transcription factors, involving E2A, EBF1 and Foxo1, that orchestrates B cell fate

Affiliations

A global network of transcription factors, involving E2A, EBF1 and Foxo1, that orchestrates B cell fate

Yin C Lin et al. Nat Immunol. 2010 Jul.

Abstract

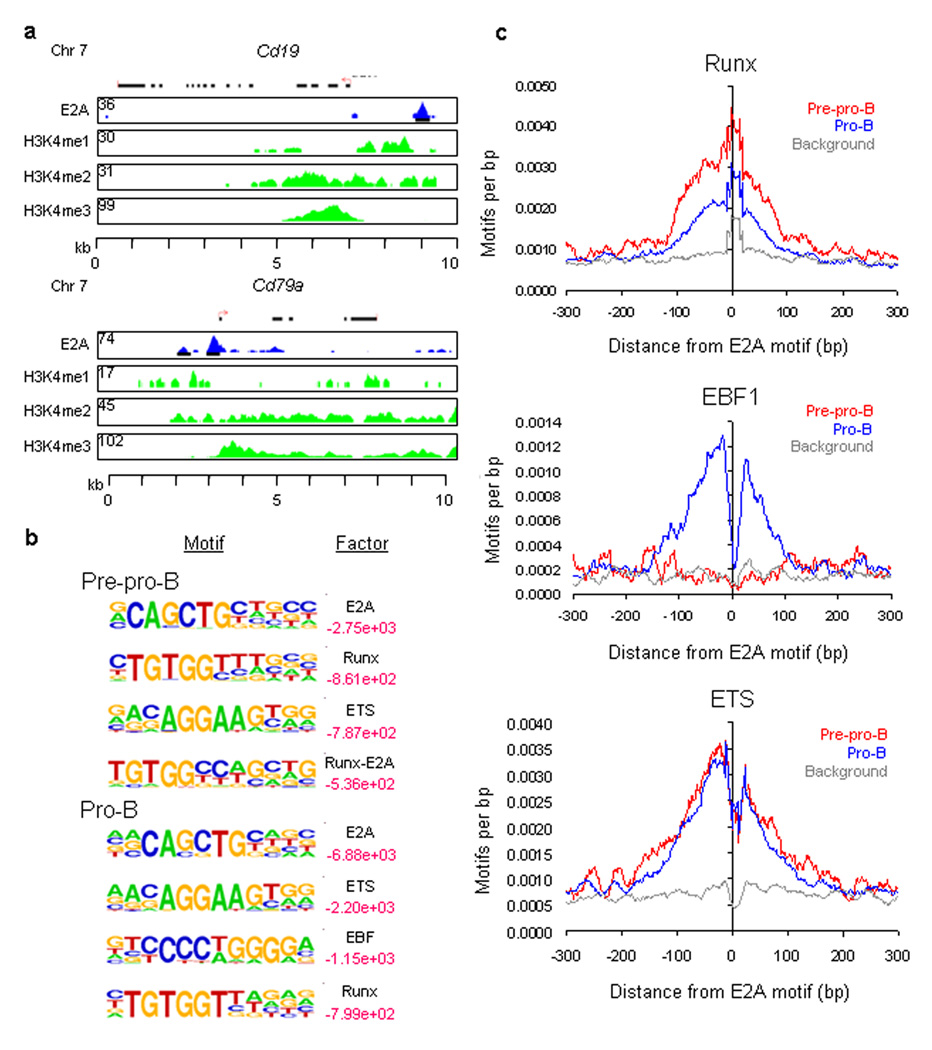
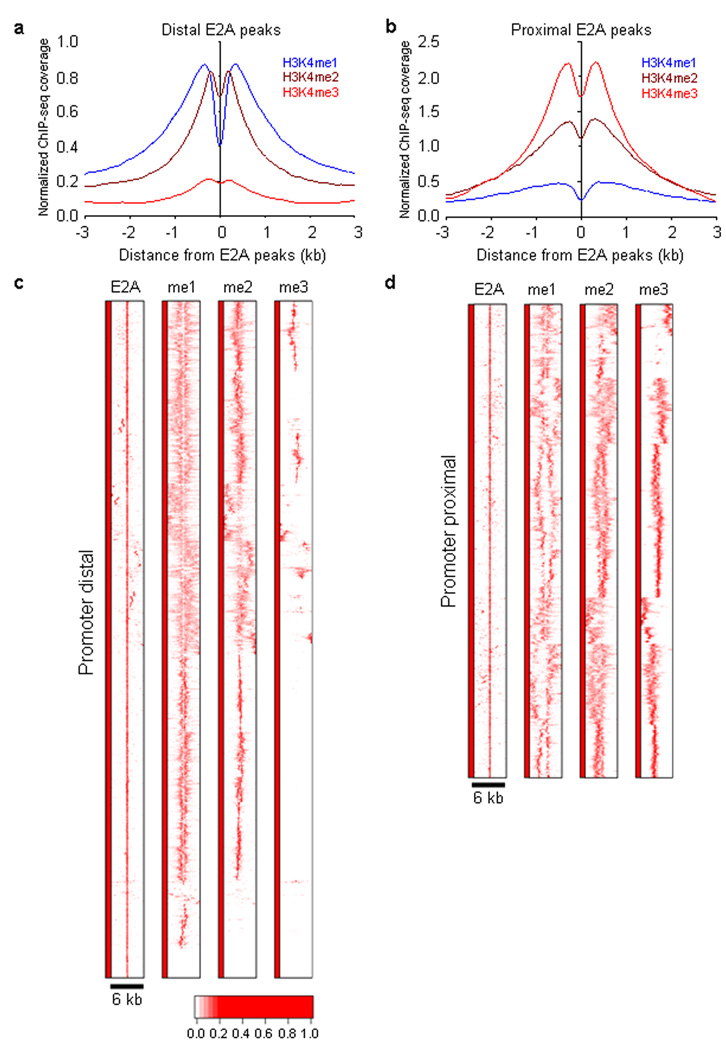
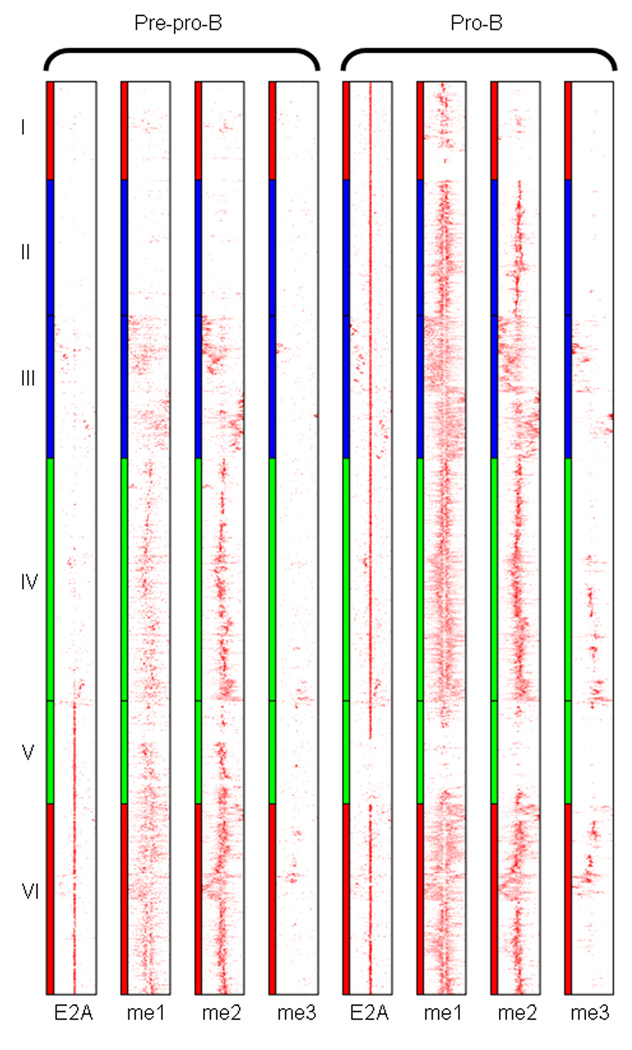
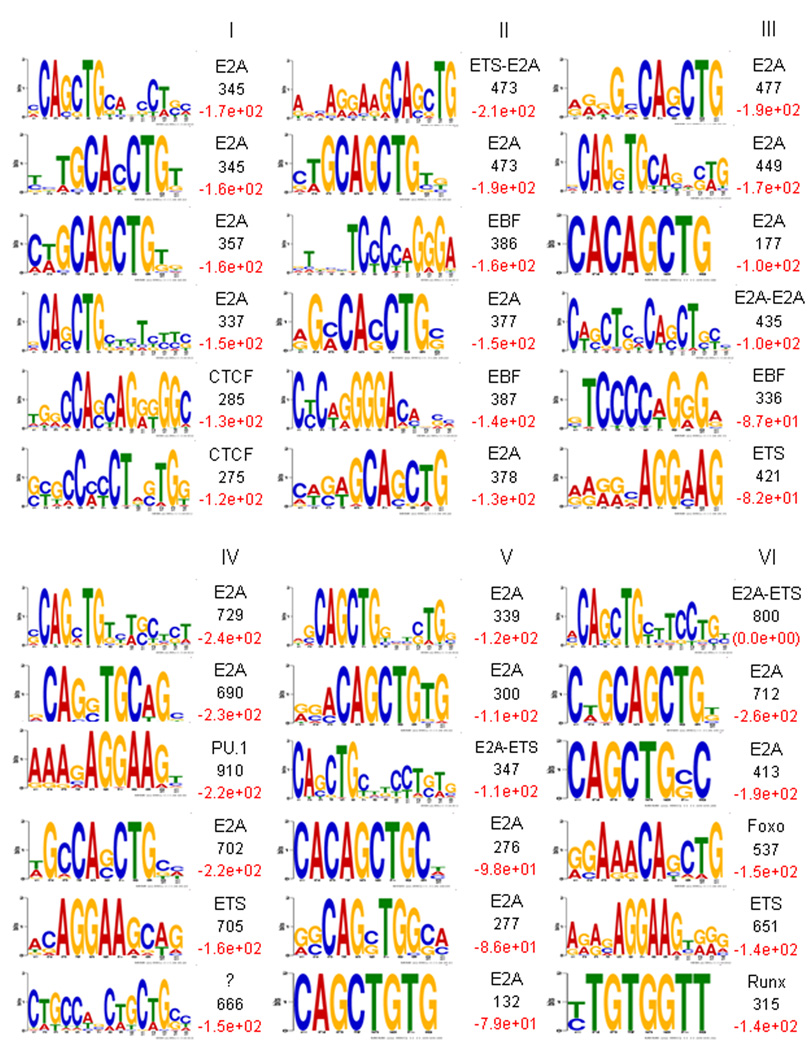
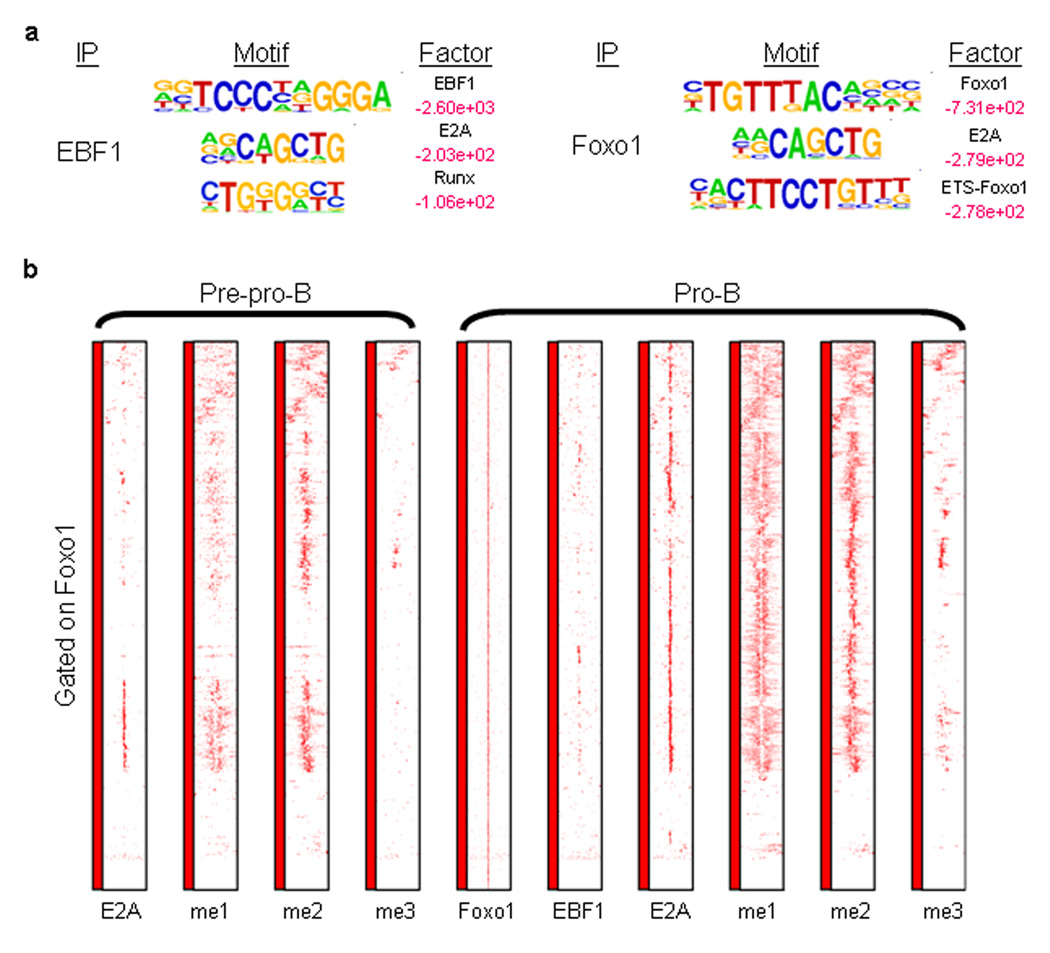
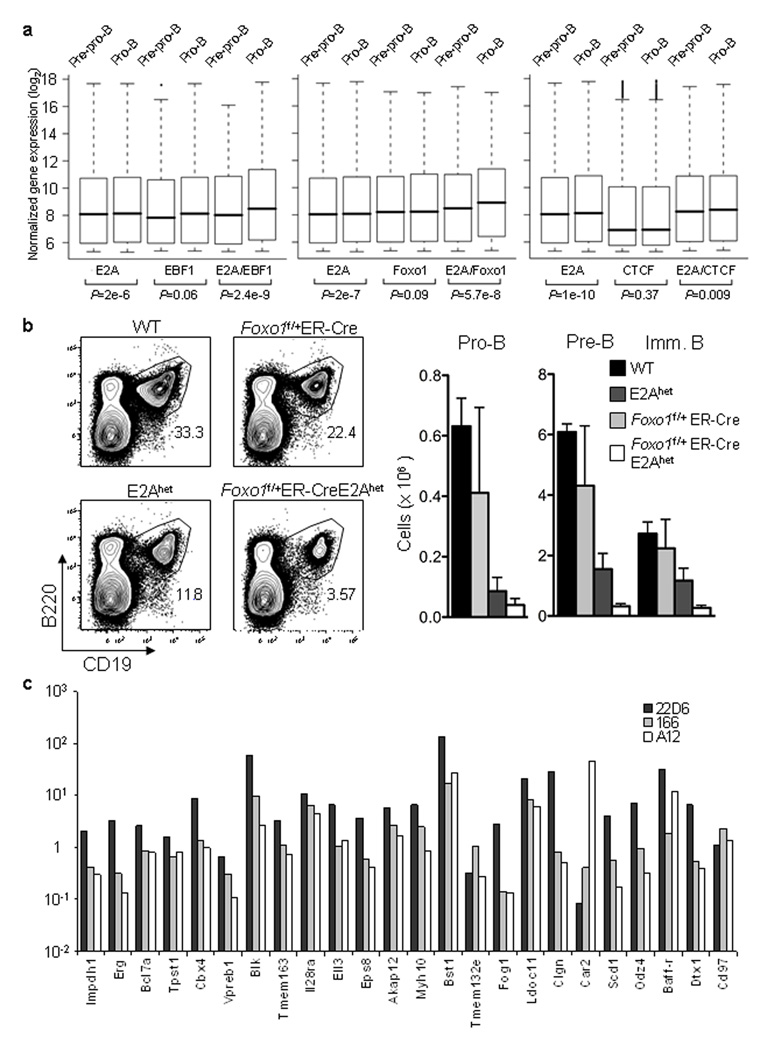
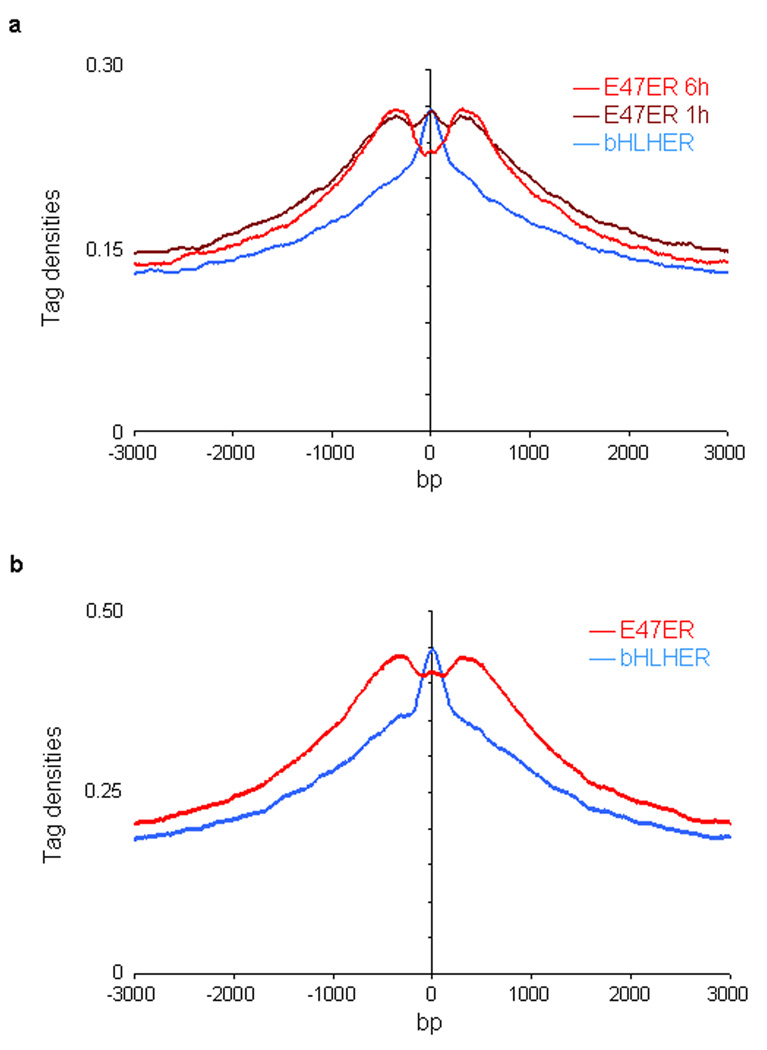
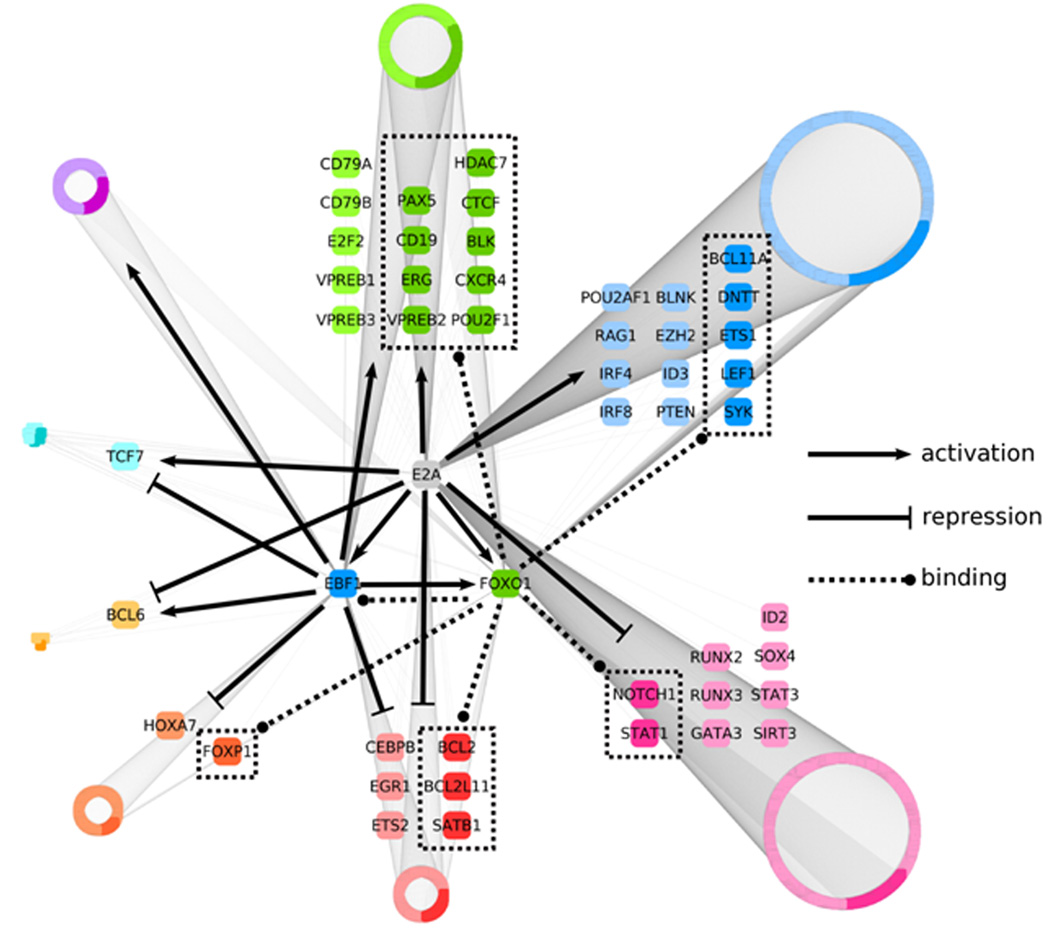
It is now established that the transcription factors E2A, EBF1 and Foxo1 have critical roles in B cell development. Here we show that E2A and EBF1 bound regulatory elements present in the Foxo1 locus. E2A and EBF1, as well as E2A and Foxo1, in turn, were wired together by a vast spectrum of cis-regulatory sequences. These associations were dynamic during developmental progression. Occupancy by the E2A isoform E47 directly resulted in greater abundance, as well as a pattern of monomethylation of histone H3 at lysine 4 (H3K4) across putative enhancer regions. Finally, we divided the pro-B cell epigenome into clusters of loci with occupancy by E2A, EBF and Foxo1. From this analysis we constructed a global network consisting of transcriptional regulators, signaling and survival factors that we propose orchestrates B cell fate.


Figures

Figure 1
Figure 1
E2A occupancy and epigenetic marking in cultured EBF-deficient pre-pro-B and RAG1-deficient pro-B cells. (a) E2A DNA binding sites in the Cd19 and Cd79a loci. Binding sites were identified using ChIP-Seq. UCSC Genome Browser was used to visualize binding patterns. Blue pattern refers to E2A occupancy. Green patterns refer to H3K4 methylation. Red arrow refers to transcription initiation sites. Numbers refer to the number of tags observed. Regions of H3K4me1, H3K4me2 and H3K4me3 are shown. (b) Cis-regulatory sequences associated with E2A occupancy in pre-pro-B and pro-B cells. Motifs that companion E2A occupancy were identified by comparing enriched peaks to random selected genomic DNA sequences. Log p-values are indicated in red. Smaller values represent relative high enrichment for a given motif as compared to randomly selected regions. (c) E2A occupancy is tightly associated with cis-regulatory elements containing EBF, ETS and RUNX consensus binding sites. Relative frequencies of EBF, ETS and RUNX consensus binding sites localized within close genomic proximity of E2A bound regions. Two independent ChIP-Seq experiments were performed in order to determine E2A occupancy for pre-pro-B and pro-B cells. A total of three independent ChIP-Seq experiments were performed in order to determine the pattern of H3K4me1, H3K4me2 and H3K4me3 in pro-B cells.
Figure 2
Figure 2
E2A occupancy and H3K4 methylation in cultured RAG1-deficient pro-B cells. (a) Heat map of E2A occupancy and H3K4me1, H3K4me2 and H3K4me3 patterns for promoter-distal DNA sequences (> 3 kb separation from nearby transcription start sites). Each row represents a 6 kb genomic region showing E2A occupancy. The heat map reflects the enrichment of E2A binding and H3K4 methylation by color according a scale as indicated below. (b) Heat map of E2A occupancy and distributions of H3K4me1, H3K4me2 and H3K4me3 for promoter-proximal (< 3kb from nearby transcription initiation sites) region. (c) E2A occupancy correlates with H3K4 mono- and di-methylation in promoter distally located regions. The genomic distance distributions of H3K4 methylation (H3K4me1, H3K4me2 and H3K4me3) centered across E2A occupancy are shown across a 6 kb genomic region. (d) E2A occupancy correlates with H3K4 mono- and di-methylation in promoter-proximal located regions. The genomic distance distributions of H3K4 methylation (H3K4me1, H3K4me2 and H3K4me3) centered across E2A occupancy are shown across a 6 kb genomic region. A total of four independent ChIP-Seq experiments were performed in order to determine genome-wide E2A occupancy as well as patterns of H3K4me1, H3K4me2 and H3K4me3.
Figure 3
Figure 3
E2A occupancy and patterns of H3K4 methylation in cultured EBF1-deficient pre-pro-B and RAG1-deficient pro-B Cells. Heat map of E2A occupancy and distributions of H3K4me1, H3K4me2 and H3K4me3 patterns for promoter-distal (>3 kb from nearby transcription initiation sites) region (7296 sites). Left, distributions for pre-pro-B cells; right, distributions for pro-B cells. Each row represents a 6 kb window centered across the E2A binding site. The heat map reflects the enrichment of E2A binding and H3K4 methylation and grouped as determined by Ward hierarchical clustering method. Clustered E2A sites that comprise a group, occupied in either pre-pro-B or pro-B cells or both, are more closely related to each other than those assigned to different clusters. Clusters I, II, III, IV, V, and VI represent 785, 1083, 1140, 1940, 824, and 1524 binding sites, respectively. Eight independent ChIP-Seq experiments were performed in order to determine global E2A occupancy as well as patterns of H3K4 methylation.
Figure 4
Figure 4
Distinct cis-regulatory DNA sequences associate with E2A occupancy in cultured RAG1-deficient pro-B cells. Cis-regulatory sequences associated with E2A occupancy and patterns of H3K4 monomethylation were identified by comparison of enriched DNA binding sites (clustered according to Fig. 3) to random selected genomic DNA sequences. Cis-regulatory sequences were gated on DNA sequences located plus or minus 100 bp from the E2A binding sites. Sequences distinct from each cluster were pooled and analyzed by MEME algorithm. The top 6 scoring motifs (ranked by log P-value as determined by HOMER are indicated in red, right) are listed for each cluster. The number of non-redundant motif occurrence is indicated in black (right). Transcription factors associated with cis-regulatory sequences (CTCF, ETS, EBF, Pu.1, Foxo, Runx) are indicated.
Figure 5
Figure 5
Distinct patterns of H3K4 monomethylation are associated with coordinate E2A and EBF1 and FOXO1 occupancy. (a) Cis-regulatory sequences associated with EBF1 and FOXO1 occupancy. RAG1-deficient pro-B cell lysates were immunoprecipitated with antibodies directed against EBF1 and FOXO1 and analyzed by ChIP-Seq. Motifs that companion E2A occupancy were identified by comparing enriched peaks to random selected genomic DNA sequences. Log-p-values are indicated in red. Smaller values represent relative high enrichment for a given motif as compared to randomly selected regions. (b) Coordinate E2A and FOXO1 DNA binding in pro-B cells. Heat map of FOXO1 occupancy and H3K4me1, H3K4me2 and H3K4me3 patterns centered across 1118 promoter distal FOXO1 binding sites. Each row represents a 6 kbp genomic region centered across FOXO1 occupancy. The heat map reflects the enrichment of FOXO1 and E2A DNA binding as well as H3K4 methylation by color.
Figure 6
Figure 6
Coordinate E2A, EBF and FOXO1 DNA binding is associated with a B-lineage specific program of gene expression. (a) Box plots depicting the distribution of RNA expression levels of different groups of genes in pre-pro-B and pro-B cells are shown. The genes closest to the binding sites (measured from TSS) were categorized into 3 groups: E2A and EBF1 binding sites localized within 150 bp of each other, genes in the vicinity of EBF1 binding sites with no E2A peak within 150 bp and genes in the vicinity of E2A binding sites with no EBF1 peak within 150 bp. The same analysis was performed for E2A and FOXO1, and E2A and CTCF binding sites. The p-values of paired t-tests are indicated below each pair. (b) B cell development in E2Ahet;FOXO1 f/+;ER-Cre mice is severely perturbed. Bone marrow derived from wild-type, E2Ahet, FOXO1 f/+;ER-Cre as well as E2Ahet;FOXO1f/+;ER-Cre mice were analyzed for the expression of B220 and CD19. Four mice of each group were analyzed by flow cytometry. Two independent experiments were performed with similar results. (c) Enhancer activity of 24 selected H3K4 monomethylated DNA segments that show coordinate E2A and EBF1 DNA binding in pro-B cells were measured in a pro-B cell line (22D6) and two T cell lines (A12 and 166).
Figure 7
Figure 7
E47 DNA binding alters the pattern of H3K4 monomethylation. (a) Forced E47 expression in E2A-deficient pre-pro-B cells promotes the establishment of a bimodal distribution of H3K4me1 centered across E2A occupancy. E2A-deficient pre-pro-B cells were transduced with virus carrying the full-length coding DNA sequence of E47 fused to the estrogen receptor domain (E47ER). As a control, cells were transduced with virus expressing the E47 bHLH domain fused to the ER domain (bHLHER). Twenty-one hours post infection, cells were incubated with tamoxifen to induce E47 activity for either one or six hours, harvested, formaldehyde cross-linked, immunoprecipitated with an anti-E2A or anti-H3K4me1 antibody, and analyzed by ChIP-Seq. X-axis shows the genomic distance from E2A bound regions. Y-axis shows the individual immunoprecipitated mapped reads (or tags) per base pair. (b) Forced E47 expression in E2A-deficient T cells promotes the establishment of a bimodal distribution of H3K4me1 centered across E2A occupancy. E2A-deficient A12 cells were transduced with virus and analyzed by ChIP-Seq as described above.
Figure 8
Figure 8
Regulatory network that links the activities of an ensemble of transcriptional regulators, signaling components and survival factors in developing B cells into a common pathway. An integrative genome-wide analysis, using Cytoscape software, of protein-DNA binding and changes in transcript levels across E2A-deficient pre-pro-B, EBF1-deficient pre-pro-B and pro-B cells was used to identify transcriptional regulatory targets of E2A and EBF1, as well as genes bound by FOXO1. Resulting 2045 regulatory targets were divided into eight groups based on positive or negative changes in transcript levels in pro-B cells as compared to E2A or EBF1-deficient cells. Arrows represent gene activation whereas barred lines indicate transcriptional repression. Dotted lines represent FOXO1 occupancy. Selected genes from each group either known to play critical roles in B cell commitment or potential novel regulators are enlarged. All other genes are grouped into rings where the size of each ring indicates the relative number of members. Darker colors present loci that show FOXO1 occupancy.

Comment in

References

    1. Cosgrove MS. Histone proteomics and the epigenetic regulation of nucleosome mobility. Expert Rev. Proteomics. 2007;4:465–478. - PubMed
    1. Ruthenburg AJ, Li H, Patel DJ, Allis CD. Multivalent engagement of chromatin modifications by linked binding modules. Nat. Rev. Mol. Cell Biol. 2007;8:983–994. - PMC - PubMed
    1. Pokholok DK, et al. Genome-wide map of nucleosome acetylation and methylation in yeast. Cell. 2005;26:517–527. - PubMed
    1. Heintzman ND, et al. Distinct and predictive chromatin signatures of transcriptional promoters and enhancers in the human genome. Nat. Genet. 2007;39:311–318. - PubMed
    1. Kee BL, Murre C. Induction of EBF and multiple B lineage genes by the helix-loop-helix protein E12. J Exp. Med. 1998;188:699–713. - PMC - PubMed

Publication types

MeSH terms

Associated data