. 2010 Jul;12(7):696-702.
doi: 10.1038/ncb2072. Epub 2010 Jun 13.

Myosin II isoforms identify distinct functional modules that support integrity of the epithelial zonula adherens

Affiliations

Myosin II isoforms identify distinct functional modules that support integrity of the epithelial zonula adherens

Michael Smutny et al. Nat Cell Biol. 2010 Jul.

Abstract

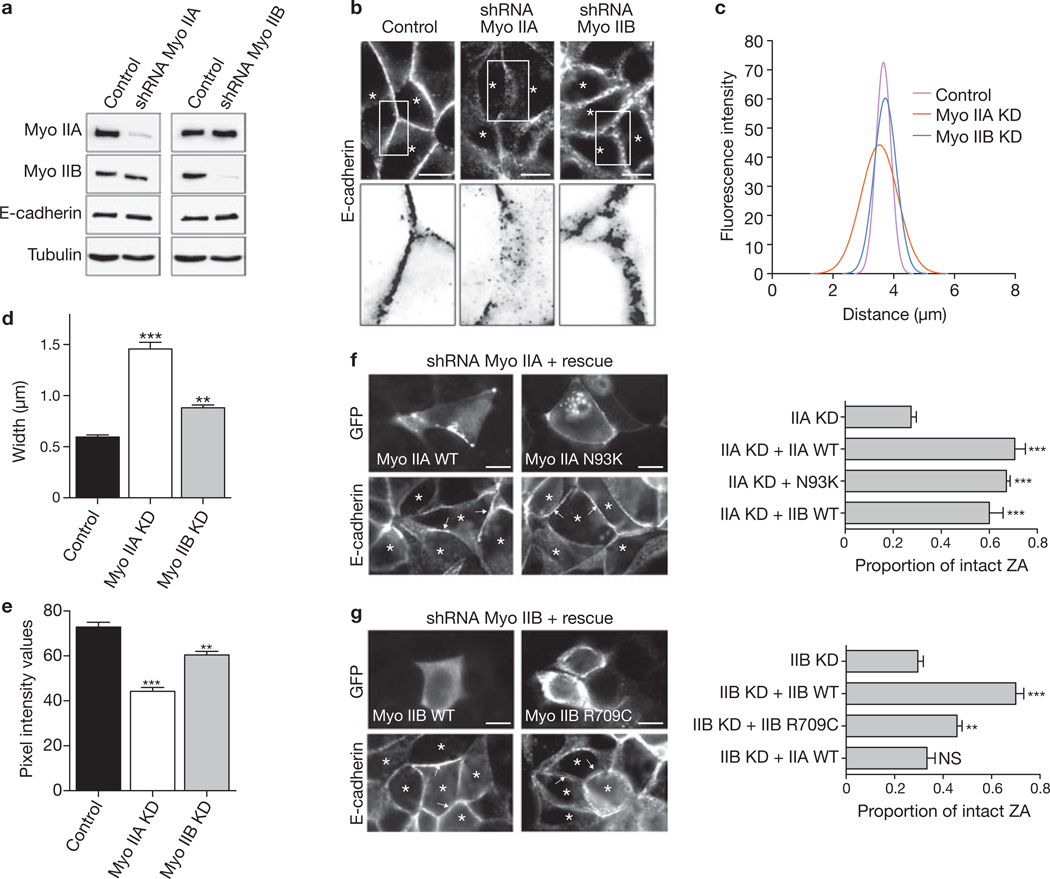
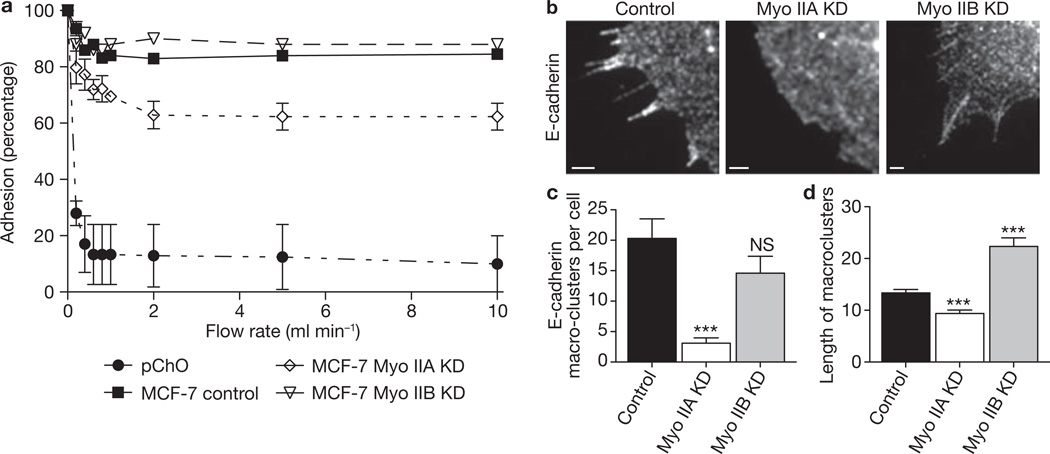
Classic cadherin receptors cooperate with regulators of the actin cytoskeleton to control tissue organization in health and disease. At the apical junctions of epithelial cells, the cadherin ring of the zonula adherens (ZA) couples with a contiguous ring of actin filaments to support morphogenetic processes such as tissue integration and cellular morphology. However, the molecular mechanisms that coordinate adhesion and cytoskeleton at these junctions are poorly understood. Previously we identified non-muscle myosin II as a target of Rho signalling that supports cadherin junctions in mammalian epithelial cells. Myosin II has various cellular functions, which are increasingly attributable to the specific biophysical properties and regulation of its different isoforms. Here we report that myosin II isoforms have distinct and necessary roles at cadherin junctions. Although two of the three mammalian myosin II isoforms are found at the ZA, their localization is regulated by different upstream signalling pathways. Junctional localization of myosin IIA required E-cadherin adhesion, Rho/ROCK and myosin light-chain kinase, whereas junctional myosin IIB depended on Rap1. Further, these myosin II isoforms support E-cadherin junction integrity by different mechanisms. Myosin IIA RNA-mediated interference (RNAi) selectively perturbed the accumulation of E-cadherin in the apical ZA, decreased cadherin homophilic adhesion and disrupted cadherin clustering. In contrast, myosin IIB RNAi decreased filament content, altered dynamics, and increased the lateral movement of the perijunctional actin ring. Myosin IIA and IIB therefore identify two distinct functional modules, with different upstream signals that control junctional localization, and distinct functional effects. We propose that these two isoform-based modules cooperate to coordinate adhesion receptor and F-actin organization to form apical cadherin junctions.


Figures

Figure 1
Figure 1. Myosin (Myo) IIA and myosin IIB localize to apical epithelial junctions
(a) Confluent MCF-7 cells were fixed and immunostained for E-cadherin (magenta) and for myosin IIA (green) or myosin IIB (green). Representative confocal images were taken from the apical junctions of the cells. Magnifications show detailed colocalization of E-cadherin with myosin II isoforms and the distribution of proteins along the z axis of cells are represented in x–z views (where apical is up). Arrows indicate enrichment of E-cadherin and myosin II at the apical tips of cell–cell contacts. (b) Confocal images show co-localization of myosin IIA (green) and myosin IIB (magenta) at apical junctions in MCF-7 monolayers. (c) E-cadherin RNAi. MCF-7 cells were transfected with siRNA against E-cadherin or scrambled (scr.) siRNA; E-cadherin levels were assessed by immunoblot analysis 48 h after transfection. Tubulin was used as a loading control. (d) E-cadherin KD cells were fixed 48 h after transfection and immunostained for E-cadherin and either myosin IIA or myosin IIB; x–y images in the apical plane and x–z reconstructions are shown. Arrows indicate apical regions of cell–cell contacts. (e) Junctional accumulation of myosin II isoforms was quantified by measuring fluorescence intensity at cell–cell contacts in control and E-cadherin KD cells. Data are represented as means ± s.e.m. (n = 21; three asterisks, P < 0.001; Student’s t-test). Scale bars, 10 µm.
Figure 2
Figure 2. Differential regulation of myosin IIA and myosin IIB localization at apical junctions
(ac) Impact of Rho and ROCK on junctional localization of myosin II isoforms. MCF-7 monolayers were incubated with Y-27632 (5–10 µM), the Rho inhibitor C3-transferase (C3-T, 0.5 µg ml−1) or dimethylsulphoxide (DMSO) for 3 h, then fixed and immunostained for E-cadherin and myosin IIA or myosin IIB. (a) Representative apical confocal images. (b, c) Junctional localization of myosin IIA or myosin IIB was quantified by fluorescence intensity analysis of contacts in cells treated with C3-T (b) or Y-27632 (c). Data are means and s.e.m. (n = 24). (d) MLCK supports junctional localization of myosin IIA but not that of myosin IIB. Myosin isoform localization at junctions was quantified in cells treated with ML7 (10 µM, 3 h). Data are represented as means ± s.e.m. (n = 24). (e) Myosin activity is necessary for junctional localization of myosin IIA but not that of myosin IIB. Junctional localization of myosin II isoforms was measured in cells treated with blebbistatin (blebbi.) (100 µM, 3 h). Data are represented as means ± s.e.m. (n = 24). (f, g) Rap1 supports junctional localization of myosin IIB. MCF-7 cells were transfected with siRNA against Rap 1A (100 nM) or scrambled siRNA (100 nM). (f) After 48 h cells were fixed and immunostained for Rap 1 and either myosin IIA or myosin IIB. Transfected cells that show reduced levels of Rap1 are identified with asterisks in the myosin staining. (g) Junctional localization of myosin isoforms was measured by fluorescence intensity analysis. Data are represented as means ± s.e.m. (n = 21). For all experiments: two asterisks, P < 0.01; three asterisks, P < 0.001; Student’s t-test. Scale bars, 10 µm.
Figure 3
Figure 3. Myosin IIA and myosin IIB are necessary for ZA integrity
(a) Isoform-specific myosin II depletion. MCF-7 cells were infected with lentivirus bearing shRNA directed against either myosin IIA or myosin IIB. Control cells were infected with virus coding for soluble fluorophores alone. Selective depletion of the appropriate myosin II isoform was confirmed by immunoblot analysis 10–15 days after infection. Lysates were also probed for E-cadherin and tubulin as a loading control. (b) E-cadherin morphology at cell–cell contacts was assessed by immunolabelling for E-cadherin in shRNA and control cells. Transduced cells are marked with asterisks. Contrast is inverted in the detail areas to highlight the different impact of each myosin II isoform KD on E-cadherin morphology. (ce) Changes in E-cadherin morphology at cell contacts were quantified by line scan analysis of fluorescence intensity. (c) Nonlinear fit curves of contact profiles in control and myosin isoform KD cells (n = 24). Means and s.e.m. of contact profiles are shown in Supplementary Information, Fig. S4c. (d) The lateral distribution of E-cadherin at cell–cell contacts was measured by calculating the average of the full width at half-maximum for each contact profile. (e) Peak E-cadherin fluorescence intensity in myosin isoform KD and control cells. (f, g) Rescue of junctional integrity in shRNA cells by reconstitution with wild-type or mutant myosin II transgenes. GFP-tagged, RNAi-resistant wild-type (WT) or N93K myosin IIA (f) and WT or R709C myosin IIB (g) transgenes were transiently expressed in the appropriate isoform KD cells. WT myosin IIB was also expressed in myosin IIA KD cells (f), whereas WT myosin IIA was expressed in myosin IIB KD cells (g). Cells were stained for E-cadherin and scored for restoration of an intact ZA. Representative images and quantification are shown (n = 90). Asterisks mark KD cells (identified by transduced mCherry staining, not shown). For all experiments: two asterisks, P < 0.01; three asterisks, P < 0.001; analysis of variance with Dunnett’s test. Scale bars, 10 µm.
Figure 4
Figure 4. Homophilic adhesion and lateral clustering of E-cadherin requires myosin IIA but not myosin IIB
(a) Homophilic adhesion of E-cadherin to cadherin-coated substrata was measured for control and myosin isoform KD MCF-7 cells. Adhesion in laminar-flow assays was expressed as the percentage of cells that remained adherent to hE/Fc-coated substrata at increasing flow rates. E-cadherin-deficient CHO (pCHO) cells were used as negative controls. Data are represented as means ± s.e.m. (n = 3 independent experiments). (bd) Lateral cadherin clustering was assessed in planar adhesion assays. Control MCF-7 cells, or Myo IIA and Myo IIB KD cells, were allowed to spread onto hE/Fc-coated substrata for 70 min; they were then fixed and stained for cellular E-cadherin to identify streak-like cadherin macroclusters (b). Images represent regions of the cell interface with hE/Fc-coated substrata revealed by confocal microscopy. Scale bars, 1 µm. (c) E-cadherin macroclusters were quantified by counting the number of macroclusters in myosin II isoform KD and control cells. Data are represented as means ± s.e.m. (n = 10). (d) E-cadherin macrocluster length was quantified by measuring the number of pixels along each cluster in control and KD cells. Data are represented as means ± s.e.m. (n = 60). Two asterisks, P < 0.01; Student’s t-test.
Figure 5
Figure 5. Myosin IIB regulates the apical F-actin ring
(a) Representative confocal images of the perijunctional F-actin ring in control and myosin II isoform KD cells identified by phalloidin staining. Detailed views of F-actin at cell–cell contacts are shown below in magnifications. Scale bars, 10 µm. (bc) F-actin content in the perijunctional rings was quantified by line scan profile analysis of fluorescence intensity at contacts between control and myosin isoform KD cells. (b) Nonlinear fit curves of pooled intensity profiles (n = 24). Intensity profiles (means and s.e.m.) are shown in Supplementary Information, Fig. S6a. (c) Average peak fluorescence intensity values of actin in knockdown and control cells. Data are means and s.e.m. (n = 24; three asterisks, P < 0.001; Student’s t-test). (d) Junctional actin turnover in control or myosin isoform KD MCF-7 cells. Transiently transfected GFP–actin was revealed by live-cell imaging, and GFP–actin in the apical actin ring was bleached in a region of interest. FRAP recovery is represented by curve fits of GFP–actin fluorescence (n = 8); average fluorescence intensity profiles (± s.e.m.) are shown in Supplementary Information, Fig. S6b. (e) Lateral movement of the apical actin ring. Kymographs from photobleaching data were performed by using line scans perpendicular to the GFP–actin ring. Representative kymographs, an illustration of the quantification method, and scatter plots of lateral movement are shown (n = 8; two asterisks, P < 0.001; analysis of variance with Dunnett’s test). Lateral movement of the ring away from the initial position (red line) was calculated by measuring the angle between the initial position and the final position in either direction (blue dotted lines show the extremes of angles).

Comment in

Similar articles

Cited by

References

    1. Boller K, Vestweber D, Kemler R. Cell-adhesion molecule uvomorulin is localized in the intermediate junctions of adult intestinal epithelial cells. J. Cell Biol. 1985;100:327–332. - PMC - PubMed
    1. Hirano S, Nose A, Hatta K, Kawakami A, Takeichi M. Calcium-dependent cell–cell adhesion molecules (cadherins): subclass specificities and possible involvement of actin bundles. J. Cell Biol. 1987;105:2501–2510. - PMC - PubMed
    1. Yonemura S, Itoh M, Nagafuchi A, Tsukita S. Cell-to-cell adherens junction formation and actin filament organization: similarities and differences between non-polarized fibroblasts and polarized epithelial cells. J. Cell Sci. 1995;108:127–142. - PubMed
    1. Sawyer JK, Harris NJ, Slep KC, Gaul U, Peifer M. The Drosophila afadin homologue Canoe regulates linkage of the actin cytoskeleton to adherens junctions during apical constriction. J. Cell Biol. 2009;186:57–73. - PMC - PubMed
    1. Vaezi A, Bauer C, Vasioukhin V, Fuchs E. Actin cable dynamics and Rho/ROCK orchestrate a polarized cytoskeletal architecture in the early steps of assembling a stratified epithelium. Dev. Cell. 2002;3:367–381. - PubMed

Publication types