. 2010 Jul;13(7):852-60.
doi: 10.1038/nn.2574. Epub 2010 Jun 13.

Na+ imaging reveals little difference in action potential-evoked Na+ influx between axon and soma

Affiliations

Na+ imaging reveals little difference in action potential-evoked Na+ influx between axon and soma

Ilya A Fleidervish et al. Nat Neurosci. 2010 Jul.

Abstract

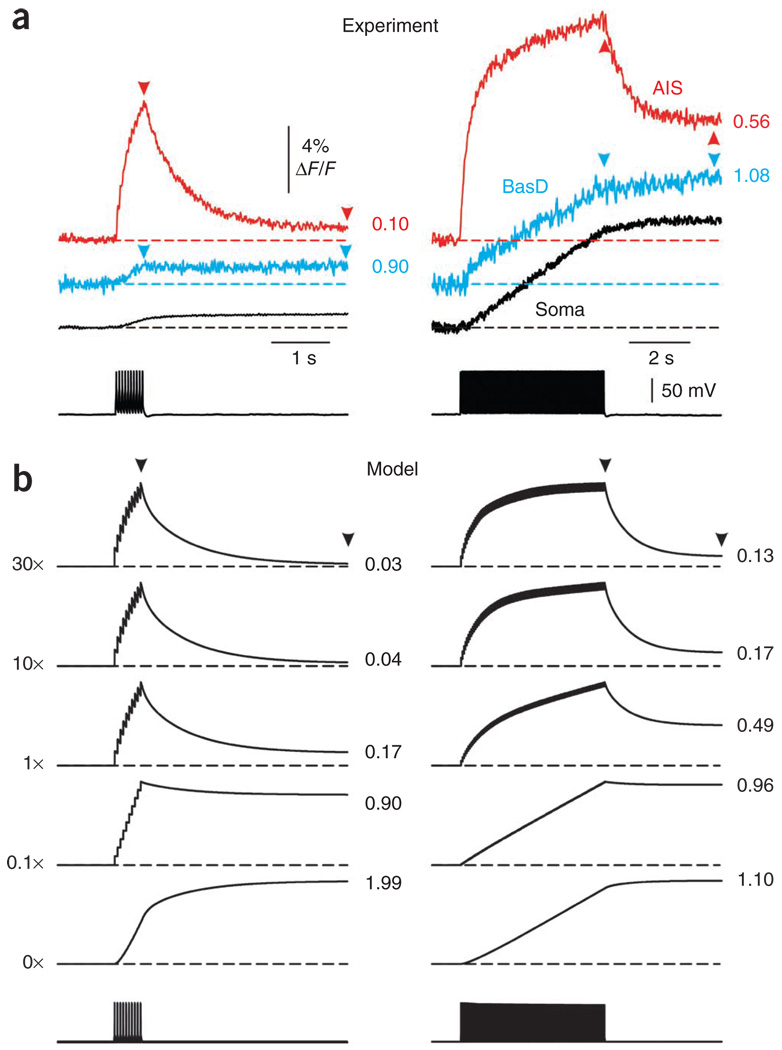
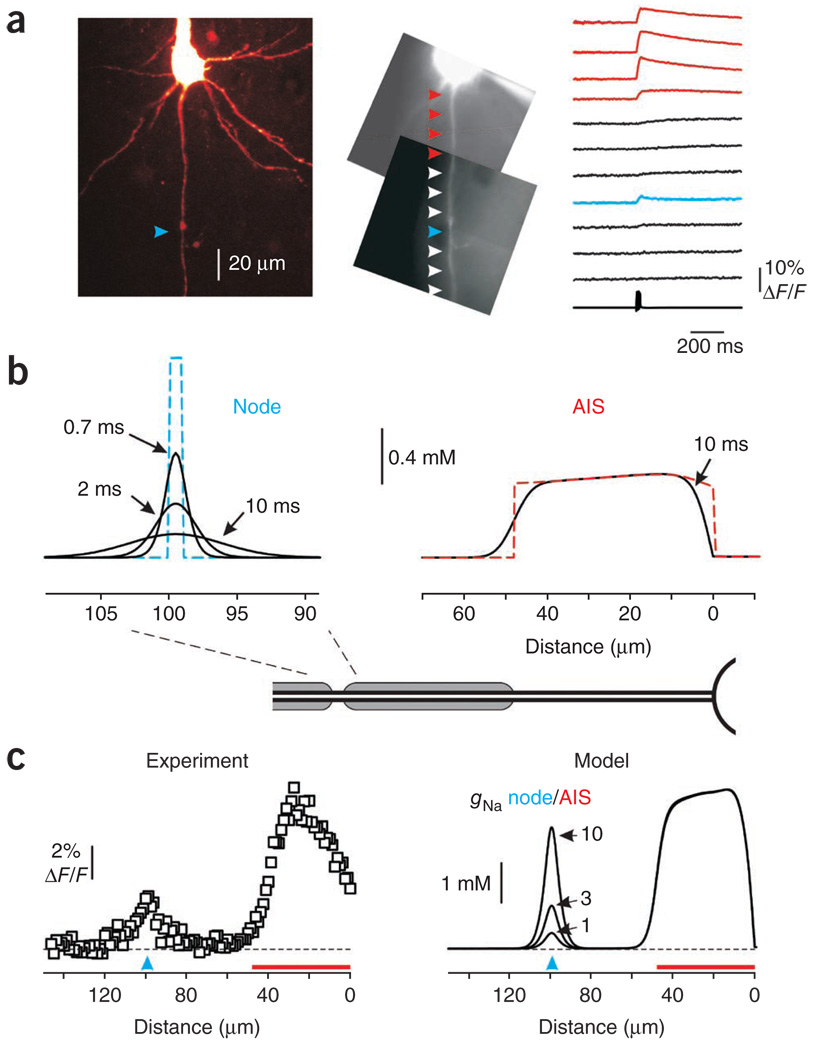
In cortical pyramidal neurons, the axon initial segment (AIS) is pivotal in synaptic integration. It has been asserted that this is because there is a high density of Na(+) channels in the AIS. However, we found that action potential-associated Na(+) flux, as measured by high-speed fluorescence Na(+) imaging, was about threefold larger in the rat AIS than in the soma. Spike-evoked Na(+) flux in the AIS and the first node of Ranvier was similar and was eightfold lower in basal dendrites. At near-threshold voltages, persistent Na(+) conductance was almost entirely axonal. On a time scale of seconds, passive diffusion, and not pumping, was responsible for maintaining transmembrane Na(+) gradients in thin axons during high-frequency action potential firing. In computer simulations, these data were consistent with the known features of action potential generation in these neurons.


Figures

Figure 1
Figure 1
Time course of action potential–induced [Na+]i changes is different in different compartments. (a) Reconstruction of 58 optical sections taken at 1-µm intervals through part of a layer 5 pyramidal neuron filled with 2 mM SBFI. (b) Left, the same neuron as seen during the fluorescence imaging experiment with a NeuroCCD-SMQ camera. The rectangles and arrows indicate the regions from which fluorescence measurements were obtained. Middle, averaged Na+ transients (n = 20) elicited by a single action potential were only prominent in the axon. Between 0–30 µm, the transients peaked sharply at the time of the spike, whereas the rise was more gradual between 30 and 40 µm. Right, averaged Na+ transients (n = 10) elicited by a train of ten spikes (33 Hz) were detected in soma, basal and apical dendrites, although they were larger in the axon. In the proximal axon, [Na+]i grew throughout the duration of the train; immediately after the train, the [Na+]i declined rapidly. In soma and dendrites, [Na+]i stayed at a nearly steady level after the end of the spike train.
Figure 2
Figure 2
Active transport cannot account for the rapid Na+ clearance in the axon. Left, the decay of axonal Na+ transients ~20 µm from the soma elicited by a train of ten action potentials was not affected by heating of the slice from 22 °C to 32 °C. Thin traces are superimposed best fits to a single exponential at 22 °C, 32 °C and on return of the temperature back to 22 °C. The difference was undetectable. Right, blockade of Na+/K+-ATPase with bath-applied oubain (100 µM) had little effect on axonal Na+ clearance. Thin traces are superimposed best fits of decay of the Na+ transients in control, during oubain application and following washout.
Figure 3
Figure 3
Axonal Na+ transients reflect localized Na+ influx into the AIS followed by diffusion to the soma and first myelinated internode. (a) Experimentally observed (left) and simulated (right) changes in [Na+]i elicited by a single action potential. (b) Similar [Na+]i changes elicited by ten action potentials at the indicated locations. The changes peaked after the end of the spike train (dashed line) at the dark blue and pink locations. (c) The same [Na+]i changes plotted as a function of distance from the soma for three different times after the last spike. Dots are average values (n = 9). (d) Time-to-peak of the Na+ transients elicited by a single action potential versus distance from the axon hillock (n = 5). Red continuous line calculated from a simplified model, assuming a 50-µm AIS. (e) [Na+]i changes elicited by ten action potentials in pyramidal neurons (L5) and Purkinje neurons (PC). Left, time-to-peak of the Na+ transients in pyramidal neurons (black, n = 9) and in Purkinje neurons (blue, n = 5; see Supplementary Fig. 1) versus distance from the soma. Continuous lines are fitted from the model, which assumed an AIS length of 38 µm for pyramidal cells (red) and 15 µm for Purkinje cells (blue). Right, effect of AIS length on width of the axonal Na+ transients 10 µm from the hillock of pyramidal (black, n = 8) and Purkinje neurons (blue, n = 5). Points are at the AIS lengths for the two cell types (15 µm for Purkinje cells and 40 µm for pyramidal cells). The red continuous line is the half-width of the simulated transients.
Figure 4
Figure 4
The shape of spike-evoked Na+ transients constrains the ratio of Na+ channel densities in different compartments. (a) Na+ transients elicited by 10 (left) and 100 (right) action potentials at the soma (black) in a basal dendrite (20 µm from the edge of the soma, blue) and in the AIS (20 µm from the hillock, red) of a representative neuron. Arrowheads indicate the points where the steady state and the end-of-train fluorescence values were measured and the numbers are the ratios of the steady-state to end-of-train ΔF/F values. (b) Na+ transients in models with different process-to-soma ratios of Na+ channel density. Somatic Na+ channel density was kept constant and Na+ channel density in the process was varied over the range of 0–30-fold of the somatic density (numbers along the left side of the figure). The numbers to the right of the traces are the calculated ratios of the steady-state to end-of-train signal. The model required the basal dendrite Na+ channel density to be 0.1–0.3-fold larger than the somatic density and the AIS density to be one- to threefold larger than the somatic density to match the experimentally determined signals.
Figure 5
Figure 5
Relative spike-evoked Na+ flux in different neuronal compartments. (a) Top, ΔF/F and ΔF changes at the indicated locations (colored traces) elicited by a train of five action potentials. Bottom, pseudocolor maps of the changes between the times marked by the arrowheads. (b) Action potential–evoked Na+ charge transfer derived from the amplitude of Na+ transients and morphological data. Dots represent individual measurements of ΔFF·volumearea calculated for soma (n = 14), AIS (n = 14) and basal dendrites (n = 9). Dashed lines are the mean values. (c) AIS to soma and AIS to basal dendrite Na+ charge transfer ratios calculated from ΔF (n = 11) and ΔFF·volumearea (n = 9–14) values.
Figure 6
Figure 6
Action potential–evoked Na+ charge transfer in nodes of Ranvier is comparable to the transfer in the AIS. (a) Left, reconstruction of a stack of 61 optical sections through part of a layer 5 pyramidal neuron filled with 2 mM SBFI. The first axonal branching point is ~100 µm from the hillock (blue arrowhead). Middle, the same neuron as seen during the fluorescence imaging experiment with a NeuroCCD-SMQ camera. Right, averaged Na+ transients (n = 20) elicited by a train of five action potentials (200 Hz). See also Supplementary Figure 4. (b) Simulated changes in [Na+]i elicited by a single action potential plotted against distance from the axon hillock. The node was assumed to be 1 µm long and the AIS to be 45 µm. Dashed lines are [Na+]i changes in a model with no Na+ diffusion. Black continuous lines are [Na+]i values 10 ms following the peak of the spike in the AIS and 0.7, 2 and 10 ms following the peak in the region around the node of Ranvier. (c) Experimentally observed (left) and simulated (right) changes in [Na+]i elicited by a train of five action potentials plotted against distance from the axon hillock. Left, dots are averaged ΔF/F values from each 1.15-µm-long pixel along the axon during the time interval 2–10 ms following the peak of the last spike in train. Red line, AIS; blue arrowhead, the first node of Ranvier. Right, changes in [Na+]i in models with different node-to-AIS ratios of Na+ channel density.
Figure 7
Figure 7
At subthreshold voltages, persistent Na+ current is generated predominately in the AIS. (a) A 1-s, 70-pA current step to just subthreshold voltage elicited a large [Na+]i increase in the AIS (red trace). A brief (5 ms) pulse that generated a single action potential generated a Na+ transient that rose sharply. (b) Subthreshold pulses of 0.3, 1.0 and 3.0 s each generated a [Na+]i increase that lasted the duration of the pulse. The rapid recovery at the end of the pulses indicates that the current was active throughout. A sharply rising Na+ transient elicited by a train of five action potentials at 50 Hz is shown for comparison. (c) A just subthreshold, 1-s stimulus elicited a large [Na+]i increase in the AIS (red trace), whereas the increase in the soma (black trace) was much smaller. The train of ten action potentials (40 Hz) caused sizable Na+ transients in both locations. (d) A 2-s voltage ramp from −70 to −40 mV elicited Na+ transients only in the axon. Interpolating along the ramp indicates that INaP and axonal [Na+]i both began to change at the same voltage (−57 ± 6 mV, n = 5). (e) A 2-s-long voltage ramp from −70 to 0 mV elicited Na+ signals that were clearly detectable in soma, basal and proximal apical dendrites. With this larger ramp, the membrane current and AIS optical signals still began to change at −57 ± 5 mV (n = 21), but the signals in the soma and basal dendrites began to change at −41 ± 5 mV (n = 21).
Figure 8
Figure 8
Compartmental model of an action potential that matches the fast maximal rates of rise of recorded spikes and initiates in the axon without requiring a high AIS Na+ channel density. (a) Top left, blue line indicates τm versus Vm in a model based on published recordings. Light blue and red lines represent the same relationships using scaling factors of 0.2 and 0.05. Top right, single compartment simulations of Na+ currents produced by voltage steps from −100 mV to 0 mV as if recorded with an ‘open bandwidth’ amplifier (continuous line) or filtered at 2 kHz. Bottom left, axonal action potentials (left) and the first derivative of action potential voltage (right) in the models with τm curves as indicated. The AIS Na+ conductance was 500 pS µm−2. Bottom right, maximal rate of rise versus axonal Na+ channel density (gNa) if τm is 0 (black), using scaling factors of 0.05, 0.2 and 1 relative to the model. Dashed line indicates 1,130 V s−1, the maximal measured rate of rise. (b) Effect of AIS channel density and properties on action potential initiation. Top left, with AIS gNa as in the soma, the action potential initiated simultaneously in the soma and in the AIS. Top right, with threefold higher AIS gNa and with shifted voltage dependence, initiation shifted to the axon. Bottom left, scaling Na+ channel τm by 0.2 in all compartments increases the rate of rise, shifts the threshold and enhances the axo-somatic delays and voltage gradients. Bottom right, with GNaP being 5% of the total AIS Na+ conductance, the shifts in threshold and the axo-somatic delays and voltage gradients are greater.

Comment in

References

    1. Kole MH, Stuart GJ. Is action potential threshold lowest in the axon? Nat. Neurosci. 2008;11:1253–1255. - PubMed
    1. Colbert CM, Pan E. Ion channel properties underlying axonal action potential initiation in pyramidal neurons. Nat. Neurosci. 2002;5:533–538. - PubMed
    1. Kole MH, et al. Action potential generation requires a high sodium channel density in the axon initial segment. Nat. Neurosci. 2008;11:178–186. - PubMed
    1. Hu W, et al. Distinct contributions of Na(v)1.6 and Na(v)1.2 in action potential initiation and backpropagation. Nat. Neurosci. 2009;12:996–1002. - PubMed
    1. Stuart G, Sakmann B. Amplification of EPSPs by axosomatic sodium channels in neocortical pyramidal neurons. Neuron. 1995;15:1065–1076. - PubMed

Publication types