

ECM-Aware Cell-Graph Mining for Bone Tissue Modeling and Classification
- PMID: 20543911
- PMCID: PMC2883793
- DOI: 10.1007/s10618-009-0153-2
ECM-Aware Cell-Graph Mining for Bone Tissue Modeling and Classification
Abstract
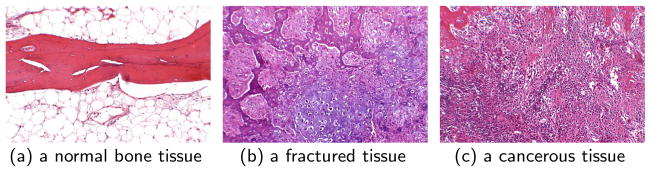
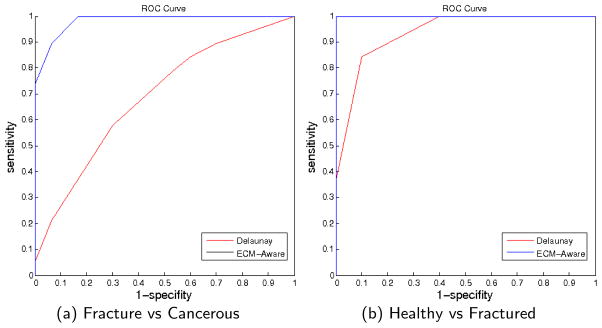
Pathological examination of a biopsy is the most reliable and widely used technique to diagnose bone cancer. However, it suffers from both inter- and intra- observer subjectivity. Techniques for automated tissue modeling and classification can reduce this subjectivity and increases the accuracy of bone cancer diagnosis. This paper presents a graph theoretical method, called extracellular matrix (ECM)-aware cell-graph mining, that combines the ECM formation with the distribution of cells in hematoxylin and eosin (H&E) stained histopathological images of bone tissues samples. This method can identify different types of cells that coexist in the same tissue as a result of its functional state. Thus, it models the structure-function relationships more precisely and classifies bone tissue samples accurately for cancer diagnosis. The tissue images are segmented, using the eigenvalues of the Hessian matrix, to compute spatial coordinates of cell nuclei as the nodes of corresponding cell-graph. Upon segmentation a color code is assigned to each node based on the composition of its surrounding ECM. An edge is hypothesized (and established) between a pair of nodes if the corresponding cell membranes are in physical contact and if they share the same color. Hence, multiple colored-cell-graphs coexist in a tissue each modeling a different cell-type organization. Both topological and spectral features of ECM-aware cell-graphs are computed to quantify the structural properties of tissue samples and classify their different functional states as healthy, fractured, or cancerous using support vector machines. Classification accuracy comparison to related work shows that ECM-aware cell-graph approach yields 90.0% whereas Delaunay triangulation and simple cell-graph approach achieves 75.0% and 81.1% accuracy, respectively.
Figures

Similar articles
-
Cell-graph mining for breast tissue modeling and classification.Annu Int Conf IEEE Eng Med Biol Soc. 2007;2007:5311-4. doi: 10.1109/IEMBS.2007.4353540. Annu Int Conf IEEE Eng Med Biol Soc. 2007. PMID: 18003206
-
Using cell nuclei features to detect colon cancer tissue in hematoxylin and eosin stained slides.Cytometry A. 2017 Aug;91(8):785-793. doi: 10.1002/cyto.a.23175. Epub 2017 Jul 20. Cytometry A. 2017. PMID: 28727286
-
A technique for semiautomatic segmentation of echogenic structures in 3D ultrasound, applied to infant hip dysplasia.Int J Comput Assist Radiol Surg. 2016 Jan;11(1):31-42. doi: 10.1007/s11548-015-1239-5. Epub 2015 Jun 20. Int J Comput Assist Radiol Surg. 2016. PMID: 26092660
-
A review of image analysis and machine learning techniques for automated cervical cancer screening from pap-smear images.Comput Methods Programs Biomed. 2018 Oct;164:15-22. doi: 10.1016/j.cmpb.2018.05.034. Epub 2018 Jun 26. Comput Methods Programs Biomed. 2018. PMID: 30195423 Review.
-
[The spatial-temporal organization of the extracellular matrix].Ontogenez. 1994 Jan-Feb;25(1):14-30. Ontogenez. 1994. PMID: 8152722 Review. Russian.
Cited by
-
Digital image analysis and machine learning-assisted prediction of neoadjuvant chemotherapy response in triple-negative breast cancer.Breast Cancer Res. 2024 Jan 18;26(1):12. doi: 10.1186/s13058-023-01752-y. Breast Cancer Res. 2024. PMID: 38238771 Free PMC article.
-
Multiscale feature analysis of salivary gland branching morphogenesis.PLoS One. 2012;7(3):e32906. doi: 10.1371/journal.pone.0032906. Epub 2012 Mar 5. PLoS One. 2012. PMID: 22403724 Free PMC article.
-
Prediction of Tuberculosis From Lung Tissue Images of Diversity Outbred Mice Using Jump Knowledge Based Cell Graph Neural Network.IEEE Access. 2024;12:17164-17194. doi: 10.1109/access.2024.3359989. Epub 2024 Jan 30. IEEE Access. 2024. PMID: 38515959 Free PMC article.
-
Coupled analysis of in vitro and histology tissue samples to quantify structure-function relationship.PLoS One. 2012;7(3):e32227. doi: 10.1371/journal.pone.0032227. Epub 2012 Mar 30. PLoS One. 2012. PMID: 22479315 Free PMC article.
-
Prediction of Growth Factor-Dependent Cleft Formation During Branching Morphogenesis Using A Dynamic Graph-Based Growth Model.IEEE/ACM Trans Comput Biol Bioinform. 2016 Mar-Apr;13(2):350-64. doi: 10.1109/TCBB.2015.2452916. IEEE/ACM Trans Comput Biol Bioinform. 2016. PMID: 27070978 Free PMC article.
References
-
- Platt J. Probabilistic outputs for support vector machines and comparison to regularized likelihood methods. Advances in Large Margin Classifiers. 2000:61–74.
-
- Lin HT, Lin CJ, Weng RC. A note on Platt’s probabilistic outputs for support vector machines. Machine Learning. 2007;68(3):267–276.
-
- Becker WM, Kleinsmith LJ, Hardin J. The world of the cell. Benjamin/Cummings Pub. Co.; 2000.
-
- Ben-Dor A, Bruhn L, Friedman N, Nachman I, Schummer M, Yakhini Z. Tissue Classification with Gene Expression Profiles. Journal of Computational Biology. 2000;7(3–4):559–583. - PubMed
-
- Bilgin C, Demir C, Nagi C, Yener B. Cell-Graph Mining for Breast Tissue Modeling and Classification. Engineering in Medicine and Biology Society, 2007. EMBS 2007. 29th Annual International Conference of the IEEE; 2007. pp. 5311–5314. - PubMed
Grants and funding
LinkOut - more resources
Full Text Sources