

Day to Day Clinically Relevant Corneal Elevation, Thickness, and Curvature Parameters Using the Orbscan II Scanning Slit Topographer and the Pentacam Scheimpflug Imaging Device
- PMID: 20543936
- PMCID: PMC2880373
- DOI: 10.4103/0974-9233.61216
Day to Day Clinically Relevant Corneal Elevation, Thickness, and Curvature Parameters Using the Orbscan II Scanning Slit Topographer and the Pentacam Scheimpflug Imaging Device
Abstract
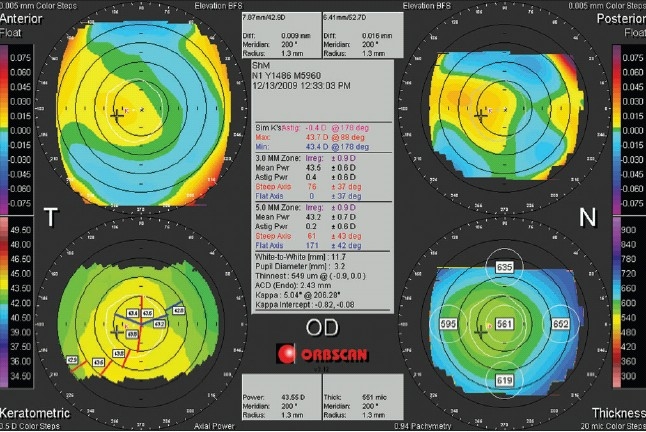
The introduction of different techniques and computerized devices into clinical ophthalmology has significantly improved our knowledge of the eyes, optics, and eye conditions. Today, corneal topography is performed with a wide range of devices that implement a variety of techniques. Advance computerized analysis systems provide us with simple and quick evaluation procedures, yet the sophisticated data and clinical information that is generated can only be interpreted with adequate knowledge of the system itself as well as the accepted normal ranges of various properties assessed with these systems. Two computerized topography systems that are in common use are the Orbscan (Bausch and Lomb Inc., Rochester, NY, USA) and the Pentacam (Oculus GmBH, Wetzlar, Germany). The Orbscan is a slit-scanning device and the Pentacam is Scheimpflug imaging device. In this review, we present a brief description of both technologies, the techniques implemented in each device and the acquisition process with each. This will be followed by a list of corneal parameters that need to be assessed in screening patients for refractive surgery. We will discuss how these parameters are displayed, how each parameter may serve as clinic criteria, and how data should be interpreted. We will also try to provide evidence regarding the accuracy of different measurements, and the comparability of the two devices.
Keywords: Corneal Curvature; Corneal Elevation; Orbscan; Pentacam; Posterior Ectasia; Scheimpflug; Slit Scanning; Topography.
Conflict of interest statement
Figures


Similar articles
-
Central Corneal Thickness in Highly Myopic Eyes: Inter-device Agreement of Ultrasonic Pachymetry, Pentacam and Orbscan II Before and After Photorefractive Keratectomy.J Ophthalmic Vis Res. 2014 Jan;9(1):14-21. J Ophthalmic Vis Res. 2014. PMID: 24982727 Free PMC article.
-
Corneal Topography.2023 Sep 4. In: StatPearls [Internet]. Treasure Island (FL): StatPearls Publishing; 2025 Jan–. 2023 Sep 4. In: StatPearls [Internet]. Treasure Island (FL): StatPearls Publishing; 2025 Jan–. PMID: 36251835 Free Books & Documents.
-
Central corneal thickness measurement with Pentacam, Orbscan II, and ultrasound devices before and after laser refractive surgery for myopia.J Cataract Refract Surg. 2007 Oct;33(10):1701-7. doi: 10.1016/j.jcrs.2007.05.040. J Cataract Refract Surg. 2007. PMID: 17889763
-
Corneal imaging with slit-scanning and Scheimpflug imaging techniques.Clin Exp Optom. 2011 Jan;94(1):33-42. doi: 10.1111/j.1444-0938.2010.00509.x. Epub 2010 Aug 16. Clin Exp Optom. 2011. PMID: 20718786 Review.
-
Galilei Corneal Tomography for Screening of Refractive Surgery Candidates: A Review of the Literature, Part II.Med Hypothesis Discov Innov Ophthalmol. 2019 Fall;8(3):204-218. Med Hypothesis Discov Innov Ophthalmol. 2019. PMID: 31598521 Free PMC article. Review.
Cited by
-
Utility of artificial intelligence in the diagnosis and management of keratoconus: a systematic review.Front Ophthalmol (Lausanne). 2024 May 17;4:1380701. doi: 10.3389/fopht.2024.1380701. eCollection 2024. Front Ophthalmol (Lausanne). 2024. PMID: 38984114 Free PMC article.
-
Topographic characteristics of keratoconus among a sample of Jordanian patients.Int J Ophthalmol. 2014 Aug 18;7(4):714-9. doi: 10.3980/j.issn.2222-3959.2014.04.24. eCollection 2014. Int J Ophthalmol. 2014. PMID: 25161949 Free PMC article.
-
Exploiting the Generative Adversarial Network Approach to Create a Synthetic Topography Corneal Image.Biomolecules. 2022 Dec 16;12(12):1888. doi: 10.3390/biom12121888. Biomolecules. 2022. PMID: 36551316 Free PMC article.
-
Effect of Iris registration on visual outcome in wavefront-guided LASEK for myopic astigmatism.Int Ophthalmol. 2018 Apr;38(2):513-525. doi: 10.1007/s10792-017-0486-6. Epub 2017 Mar 11. Int Ophthalmol. 2018. PMID: 28285388
-
Interocular Symmetry Analysis of Corneal Elevation Using the Fellow Eye as the Reference Surface and Machine Learning.Healthcare (Basel). 2021 Dec 16;9(12):1738. doi: 10.3390/healthcare9121738. Healthcare (Basel). 2021. PMID: 34946464 Free PMC article.
References
-
- Daxecker F. Christoph Scheiner's eye studies. Documenta Ophthalmol. 1992;81:27–35. - PubMed
-
- Rabinowitz YS. Ectatic disorders of the cornea. In: Foster CS, Azar DT, Dohlman CH, editors. Smolin and Thoft's the cornea: Scientific foundations and clinical practice. 4th edn. Philadelphia PA: Lippincott Williams and Wilkins; 2005. pp. 889–911.
-
- Twa MD, Coral-Ghanem C, Barth B. Corneal topography and contact lenses. In: Mannis MJ, Zadnik K, Coral-Ghanem C, Kara-Jose N, editors. Contact lenses in ophthalmic practice. New York: Springer-Verlag; 2003. pp. 37–67.
-
- Wheeldon CE, McGhee CN. Corneal tomography and anterior chamber imaging. In: Brightbill FS, editor. Corneal surgery: Theory, technique, and tissue. St Louis, MO: CV Mosby Co; 1986. pp. 83–92.
-
- Cairns G, McGhee CN. Orbscan computerized topography: Attributes, applications, and limitations. J Cataract Refract Surg. 2005;31:205–20. - PubMed
LinkOut - more resources
Full Text Sources
