. 2010 Jun 9;5(6):e11028.
doi: 10.1371/journal.pone.0011028.

Tracking antigen-specific T-cells during clinical tolerance induction in humans

Affiliations

Tracking antigen-specific T-cells during clinical tolerance induction in humans

Aamir Aslam et al. PLoS One. .

Abstract

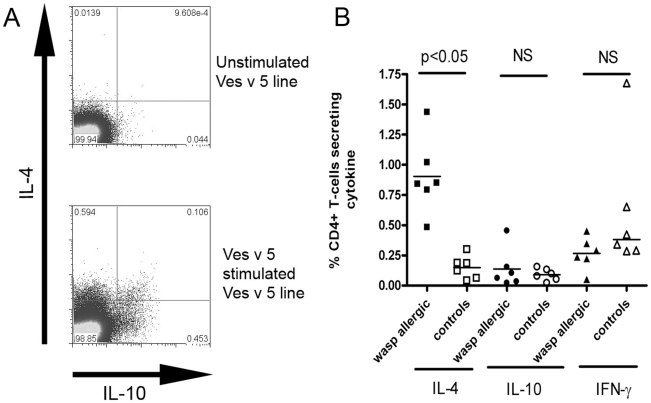
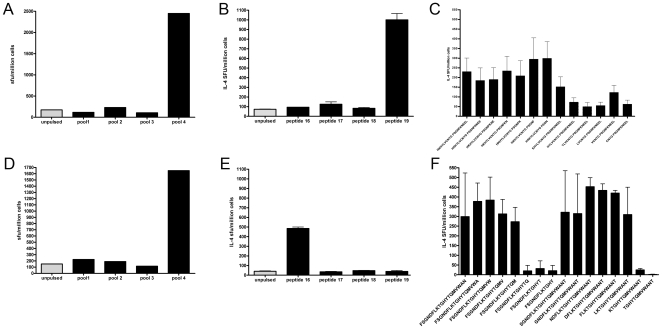
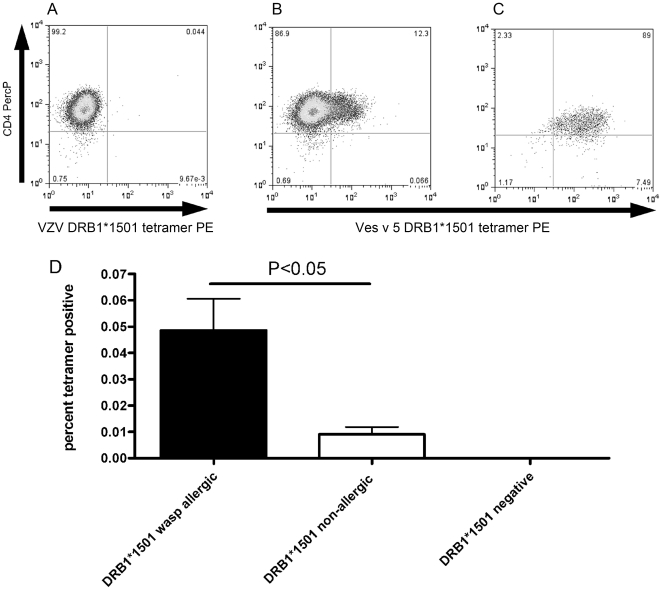
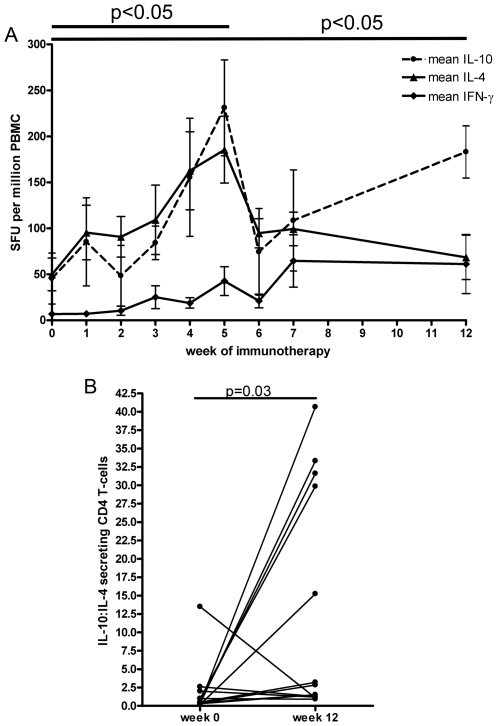
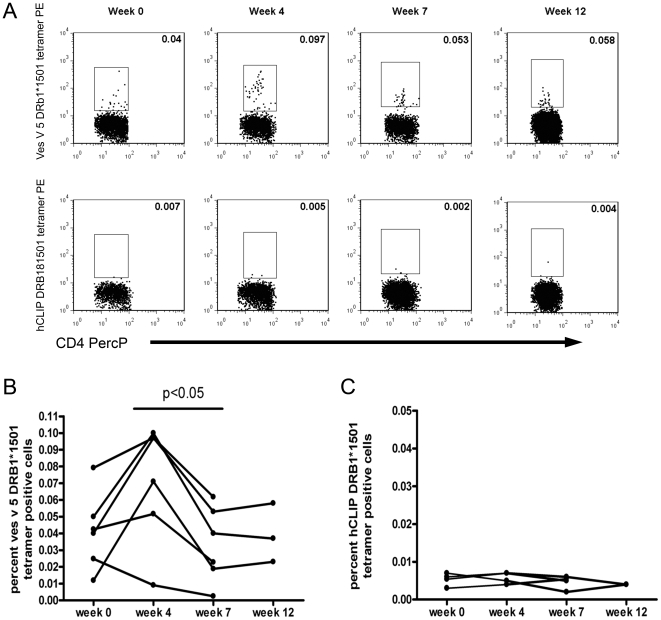
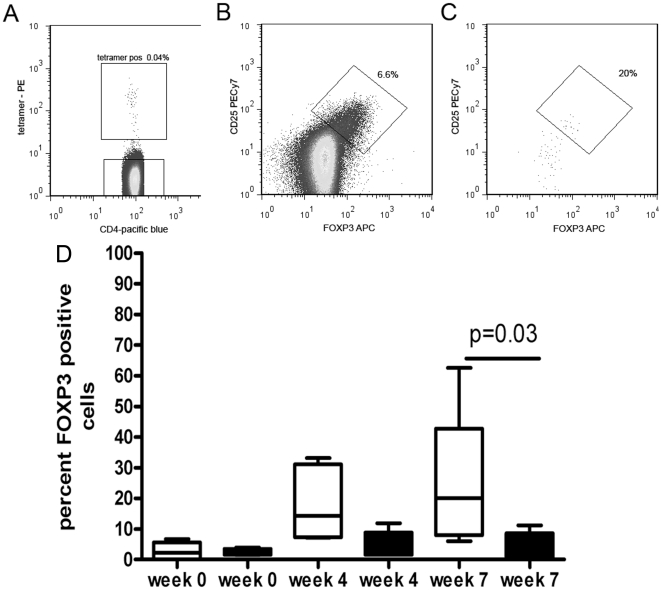
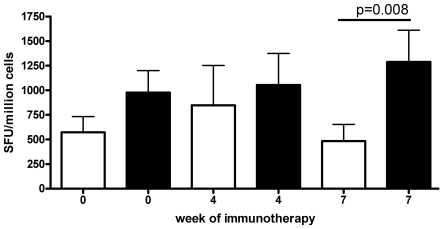
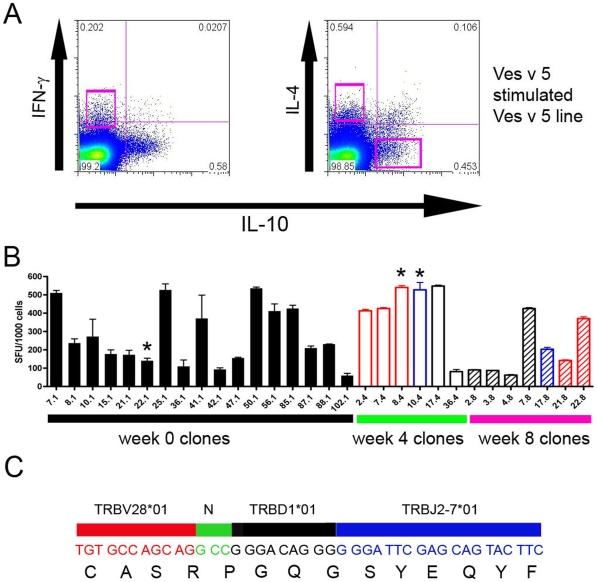
Allergen immunotherapy presents an opportunity to define mechanisms of induction of clinical tolerance in humans. Significant progress has been made in our understanding of changes in T cell responses during immunotherapy, but existing work has largely been based on functional T cell assays. HLA-peptide-tetrameric complexes allow the tracking of antigen-specific T-cell populations based on the presence of specific T-cell receptors and when combined with functional assays allow a closer assessment of the potential roles of T-cell anergy and clonotype evolution. We sought to develop tools to facilitate tracking of antigen-specific T-cell populations during wasp-venom immunotherapy in people with wasp-venom allergy. We first defined dominant immunogenic regions within Ves v 5, a constituent of wasp venom that is known to represent a target antigen for T-cells. We next identified HLA-DRB1*1501 restricted epitopes and used HLA class II tetrameric complexes alongside cytokine responses to Ves v 5 to track T-cell responses during immunotherapy. In contrast to previous reports, we show that there was a significant initial induction of IL-4 producing antigen-specific T-cells within the first 3-5 weeks of immunotherapy which was followed by reduction of circulating effector antigen-specific T-cells despite escalation of wasp-venom dosage. However, there was sustained induction of IL-10-producing and FOXP3 positive antigen-specific T cells. We observed that these IL-10 producing cells could share a common precursor with IL-4-producing T cells specific for the same epitope. Clinical tolerance induction in humans is associated with dynamic changes in frequencies of antigen-specific T-cells, with a marked loss of IL-4-producing T-cells and the acquisition of IL-10-producing and FOXP3-positive antigen-specific CD4+ T-cells that can derive from a common shared precursor to pre-treatment effector T-cells. The development of new approaches to track antigen specific T-cell responses during immunotherapy can provide novel insights into mechanisms of tolerance induction in humans and identify new potential treatment targets.


Conflict of interest statement

Competing Interests: The authors have declared that no competing interests exist.

Figures

Figure 1
Figure 1. Ves v 5 specific cytokine responses in wasp allergy.
A. T-cells were cultured for 10 days in the presence of recombinant Ves v 5 and IL-4 and IL-10 production was determined after re-stimulation with recombinant Ves v 5 (lower) and PBS - negative control (top). B. Cytokine responses of Ves v 5 T-cell lines after re-stimulation with antigen. IL-4 responses to Ves v 5 is significantly higher in individuals with a history of wasp venom anaphylaxis (N = 6) than non-allergic controls (N = 6) (P<0.05), whereas the frequency of IL-10 and IFN-γ responses does not differ between the 2 groups; student's t-test.
Figure 2
Figure 2. Identification of DRB1*1501-restricted epitopes within Ves v 5.
T-cell lines from two wasp allergic patients to rVes v 5 were re-stimulated with Ves v 5 peptide pools (a and d) and IL-4 ELISpot responses were detected to pool 4. DRB1*1501 transfected L-cells were then separately pulsed with constituent peptides from peptide pool 4 and used to stimulate rVes V 5 lines; peptides 19 and 16 were thus identified as containing HLA-DRB1*1501 restricted epitopes (b and e, respectively). T-cell lines were generated against rVes v 5 from 5 venom allergic patients and IL-4 responses were determined for different p19 (c) and p16 (f) derived sequences to reveal the minimal epitopes. SFU = spot forming units.
Figure 3
Figure 3. Detection of Ves v 5 specific T-cells with MHC Class II Ves v 5 tetrameric complexes.
Examples of DRB1*1501 tetramer staining of a day 14 cultured population using a control DRB1*1501 Varicella zoster virus peptide tetramer (a) and a wasp venom Ves v 5 DRB1*1501 tetramer (b). The Ves v 5 DRB1*1501 tetramer was also used to stain a clonal population (c). d. Ex vivo frequency of tetramer-binding cells from individuals with a history of anaphylaxis to wasp venom (N = 6) was significantly higher than from DRB1*1501-positive non-allergic controls (with a history of wasp stings, N = 4) and DRB1*1501-negative individuals (N = 4); p<0.05, student's t-test.
Figure 4
Figure 4. Longitudinal ex-vivo cytokine responses to immunotherapy.
A. Ex vivo longitudinal frequencies of cytokine producing cells during immunotherapy in response to whole wasp venom in 13 wasp allergic patients. Circles IL-10, triangles IL-4, diamonds IFN-γ. SFU (spot forming units). There was a significant effect of the week of immunotherapy on the frequency of IL-10 and IL-4 secreting T-cells (one-way ANOVA p = 0.0284 and p = 0.0368, respectively) and there was a significant rise in IL-4 and IL-10 responses at week 5 (p<0.05), which for IL-10 was maintained at 12 weeks after starting immunotherapy (p<0.05). Means and SD are displayed. B. Ratio of IL-10:IL-4 secretion over time during immunotherapy in the same 13 wasp allergic patients; p = 0.03 student's paired t-test.
Figure 5
Figure 5. Longitudinal analysis of tetramer-binding cells during immunotherapy.
A. The top line of dot-plots show the frequency of HLA-DRB1*1501 Ves V 5 peptide-tetramer binding cells from a wasp allergic patient before (week 0) and during immunotherapy. Binding of CD4+ T-cells to the control hCLIP-HLA-DRB1*1501 tetramer is shown in the lower line of dot-plots. Numbers in the top right corner of dot-plots is tetramer binding cells as a percentage of CD4+ T-cells. B. Antigen specific T-cell frequencies were followed in 6 HLA-DRB1*1501-positive individuals using HLA-DRB1*1501 Ves v 5 peptide-tetrameric complexes. Frequencies were expressed as a percentage of CD4+ T cells. There was a significant reduction (p<0.05) in the frequency of tetramer positive T-cells from weeks 4 to 7 using Student's paired t-test. C. Tetramer binding to the control hCLIP-HLA-DRB1*1501 tetramer was also followed in 4 of the individuals during immunotherapy. There was no significant change in the frequency of hCLIP-tetramer binding cells, p = 0.53, one-way ANOVA.
Figure 6
Figure 6. Longitudinal change in FOXP3+ T-cells during immunotherapy.
A. Example of dot-plot showing frequency of HLA-DRB1*1501 Ves V 5 peptide-tetramer binding cells from wasp allergic patient 7 weeks after immunotherapy. FOXP3+ CD25hi T-regs population were visualized in the tetramer negative population and were gated as shown in B. This T-reg gate was used to identify antigen-specific tetramer-binding T-regs as shown in C. D. The percentage of FOXP3 expressing cells within the tetramer-binding subset (open boxes) and the total CD4+ population (filled boxes) were determined during immunotherapy in 6 DRB1*1501 wasp allergic patients.
Figure 7
Figure 7. IL-10 is inhibiting IL-4 responses in Ves v 5 specific lines after immunotherapy.
Production of IL-4 by day 14 cultured T cells in response to recombinant Ves v 5 at different stages of immunotherapy in the absence (open boxes) or presence (filled boxes) of anti-IL-10. Addition of anti-IL-10 at week 7 restored the frequency of rVes V 5 specific IL-4 T-cells (p = 0.008, Student's paired t-test).
Figure 8
Figure 8. Identification and TCR sequencing of Ves v 5 specific T-cell clones during immunotherapy.
A. IFN-γ, IL-4 and IL-10 secreting cells were sorted using a cytokine secretion assay from day 14 cultured Ves v 5-specific T cell populations. Clones were established by in vitro expansion of single cytokine secreting cells. B. Cytokine secretion in response to antigen 5 stimulation was measured by ELISpot using IL-4 (black boxes), IFN-γ (red boxes) and IL-10 (blue boxes) derived clones, sorted before immunotherapy (week 0) and at weeks 4 and 8 of immunotherapy. Sfu spot forming units. C. Clones 22.1, 8.4 and 10.4 (*) shared an identical TCR Vbeta sequence.

Similar articles

Cited by

References

    1. Muller U, Thurnheer U, Patrizzi R, Spiess J, Hoigne R. Immunotherapy in bee sting hypersensitivity. Bee venom versus wholebody extract. Allergy. 1979;34:369–378. - PubMed
    1. Gillman SA, Cummins LH, Kozak PP, Jr, Hoffman DR. Venom immunotherapy: comparison of “rush” vs “conventional” schedules. Ann Allergy. 1980;45:351–354. - PubMed
    1. Bousquet J, Muller UR, Dreborg S, Jarisch R, Malling HJ, et al. Immunotherapy with Hymenoptera venoms. Position paper of the Working Group on Immunotherapy of the European Academy of Allergy and Clinical Immunology. Allergy. 1987;42:401–413. - PubMed
    1. Bousquet J, Fontez A, Aznar R, Robinet-Levy M, Michel FB. Combination of passive and active immunization in honeybee venom immunotherapy. J Allergy Clin Immunol. 1987;79:947–954. - PubMed
    1. Nouri-Aria KT, Wachholz PA, Francis JN, Jacobson MR, Walker SM, et al. Grass pollen immunotherapy induces mucosal and peripheral IL-10 responses and blocking IgG activity. J Immunol. 2004;172:3252–3259. - PubMed

Publication types