

doi: 10.1016/j.cpet.2009.12.007.
PET in Cerebrovascular Disease
- PMID: 20543975
- PMCID: PMC2883245
- DOI: 10.1016/j.cpet.2009.12.007
Item in Clipboard
PET in Cerebrovascular Disease
PET Clin.
.
Abstract
Investigation of the interplay between the cerebral circulation and brain cellular function is fundamental to understanding both the pathophysiology and treatment of stroke. Currently, PET is the only technique that provides accurate, quantitative in vivo regional measurements of both cerebral circulation and cellular metabolism in human subjects. We review normal human cerebral blood flow and metabolism and human PET studies of ischemic stroke, carotid artery disease, vascular dementia, intracerebral hemorrhage and aneurysmal subarachnoid hemorrhage and discuss how these studies have added to our understanding of the pathophysiology of human cerebrovascular disease.
Figures
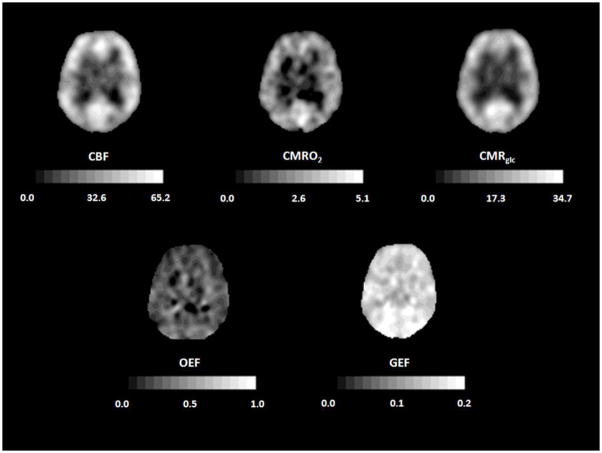
Normal cerebral blood flow and metabolism. PET scans from a normal 70 year old woman. Cerebral blood flow (CBF, mL 100g−1 min−1), cerebral metabolic rate of oxygen (CMRO2, mL 100g−1 min−1) and cerebral metabolic rate of glucose (CMRglc; micromol 100g−1 min−1) all show higher values in cortex that in white matter. Oxygen extraction fraction (OEF) and glucose extraction fraction (GEF) are relatively uniform throughout the brain. Adapted from Powers WJ, Zazulia AR. The use of positron emission tomography in cerebrovascular disease. Neuroimaging Clin N Am 2003; 13: 741–758.
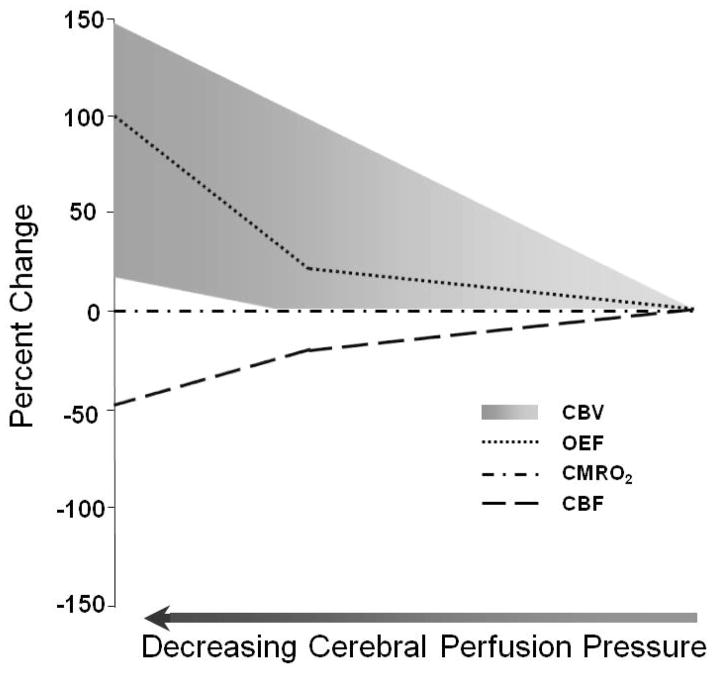
Compensatory responses to reduced cerebral perfusion pressure (CPP). As CPP falls, cerebral blood flow (CBF) is initially maintained at almost baseline levels by arteriolar dilation. When vasodilatory capacity has been exceeded, cerebral autoregulation fails and CBF begins to decrease rapidly. A progressive increase in oxygen extraction fraction (OEF) preserves (CMRO2). The response of cerebral blood volume (CBV) to reduced CPP is variable, ranging from a steady rise (of as much as 150%) to only a modest increase beginning at the point of autoregulatory failure. Adapted from Powers WJ, Zazulia AR. The use of positron emission tomography in cerebrovascular disease. Neuroimaging Clin N Am 2003; 13: 741–758.
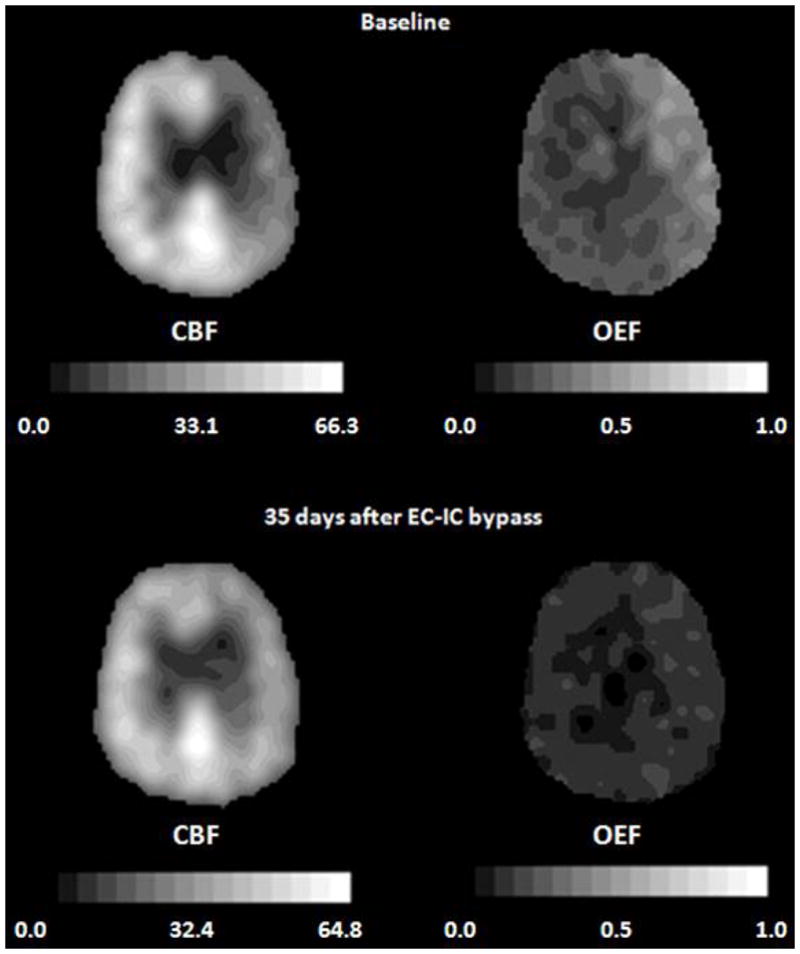
Improvement of oxygen extraction fraction (OEF) after extracranial-intracranial (EC-IC) bypass surgery in a 69-year-old man with symptomatic occlusion of the right carotid artery. The baseline PET images (top row) demonstrate reduced cerebral blood flow (CBF, mL 100g−1 min−1), and increased OEF in the right hemisphere. A second study performed 35 days after EC-IC bypass shows that ipsilateral CBF has improved and OEF has normalized (bottom row). In all images, the right side of the brain is on the reader’s right. Adapted from Powers WJ, Zazulia AR. The use of positron emission tomography in cerebrovascular disease. Neuroimaging Clin N Am 2003; 13: 741–758.
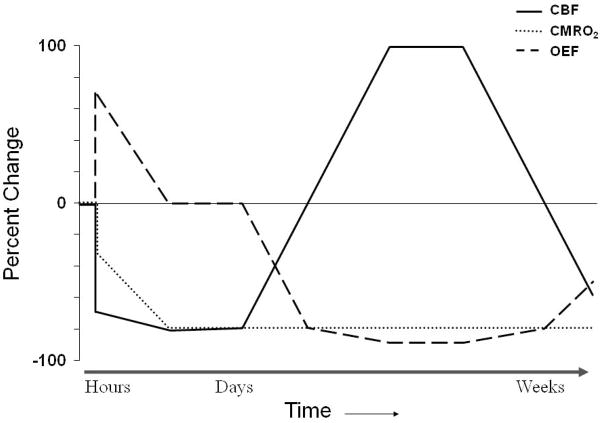
Pathophysiological changes in cerebral infarction. At the onset of ischemia, the initial fall in regional cerebral blood flow (CBF) is mirrored by a rise in regional oxygen extraction fraction (OEF). Since the increase in OEF is not sufficient to supply the energy needs of the brain, the regional cerebral metabolic rate of oxygen (CMRO2) falls to the level of oxygen delivery. With time, CMRO2 falls further even though there is only a slight further decrease in CBF, resulting in a decrease in OEF. Reperfusion via recanalization of the occluded artery or recruitment of collateral pathways results in an increase in CBF (“luxury perfusion”) and a concomitant fall in OEF below baseline with no change in CMRO2. With evolution to the stage of chronic infarction, CBF progressively declines and OEF increases, but often remains below baseline values. Adapted from Powers WJ, Zazulia AR. The use of positron emission tomography in cerebrovascular disease. Neuroimaging Clin N Am 2003; 13: 741–758.
Luxury perfusion seven days after a hemispheric infarction. Cerebral blood flow (CBF, mL 100g−1 min−1) is elevated in combination with reduced cerebral metabolic rate of oxygen (CMRO2, mL 100g−1 min−1) and OEF. Adapted from Powers WJ, Zazulia AR. The use of positron emission tomography in cerebrovascular disease. Neuroimaging Clin N Am 2003; 13: 741–758.
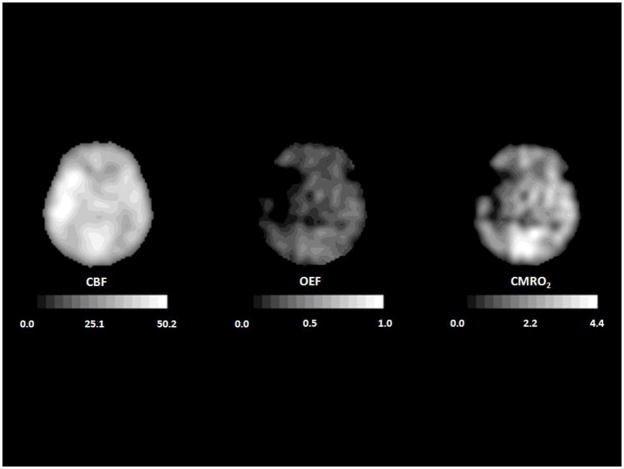
PET five months after hemispheric infarction. Cerebral blood flow (CBF, mL 100g−1 min−1) and cerebral metabolic rate of oxygen (CMRO2, mL 100g−1 min−1) are severely reduced and oxygen extraction fraction (OEF) is below normal.
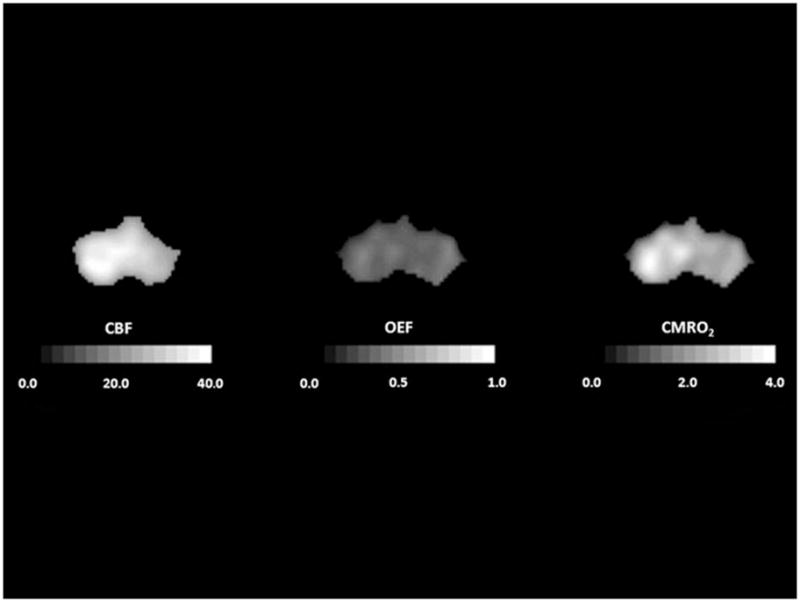
Crossed cerebellar diaschisis 5 months after a left frontal infarct. Tomographic slices through the posterior fossa demonstrate reduced cerebral blood flow (CBF, mL 100g−1 min−1) and cerebral metabolic rate of oxygen (CMRO2, mL 100g−1 min−1) in the right cerebellum. Oxygen extraction fraction (OEF) looks relatively uniform although it is usually found to be slightly elevated. In all images, the right side of the brain is on the reader’s right.
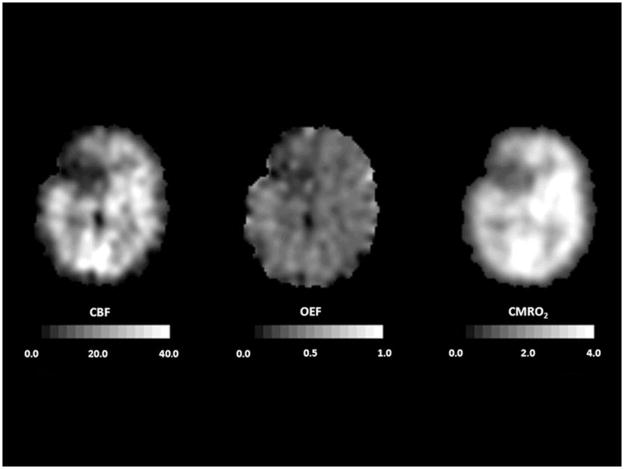
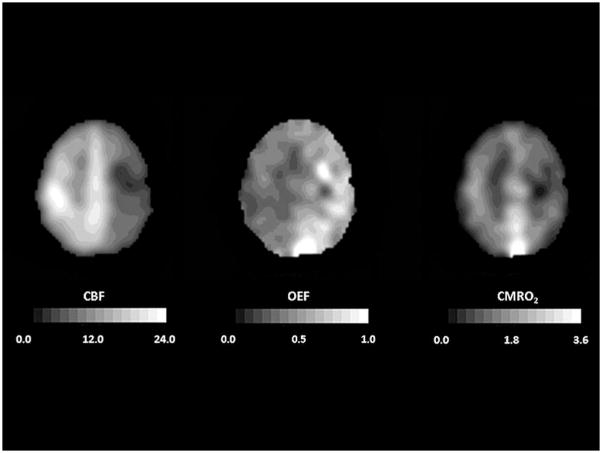
PET images corrected for partial volume effects from a 44-year old man with a putaminal hemorrhage studied 21 hours after onset. Peri-hematomal cerebral blood flow (CBF, mL 100g−1 min−1), cerebral metabolic rate of oxygen (CMRO2, mL 100g−1 min−1) and oxygen extraction fraction (OEF) are all reduced compared to the contralateral hemisphere, indicating primary metabolic depression. Adapted from Powers WJ, Zazulia AR. The use of positron emission tomography in cerebrovascular disease. Neuroimaging Clin N Am 2003; 13: 741–758.
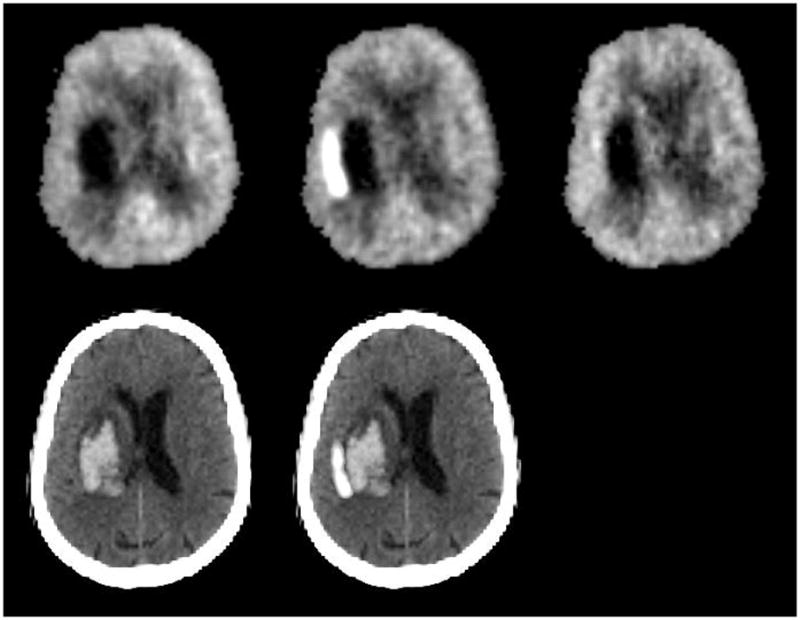
18F-fluorordeoxyglucose PET images from a 72-year-old woman with left putaminal hemorrhage studied 26 hours (top left), 2.2 days (top center), and 4.9 days (top right) after onset. Images are normalized to mean activity in the initial scan. Bottom row shows initial CT (left) and the subtraction image of the first two PET studies superimposed on the CT, demonstrating the region of increased glucose metabolism adjacent to the hematoma.
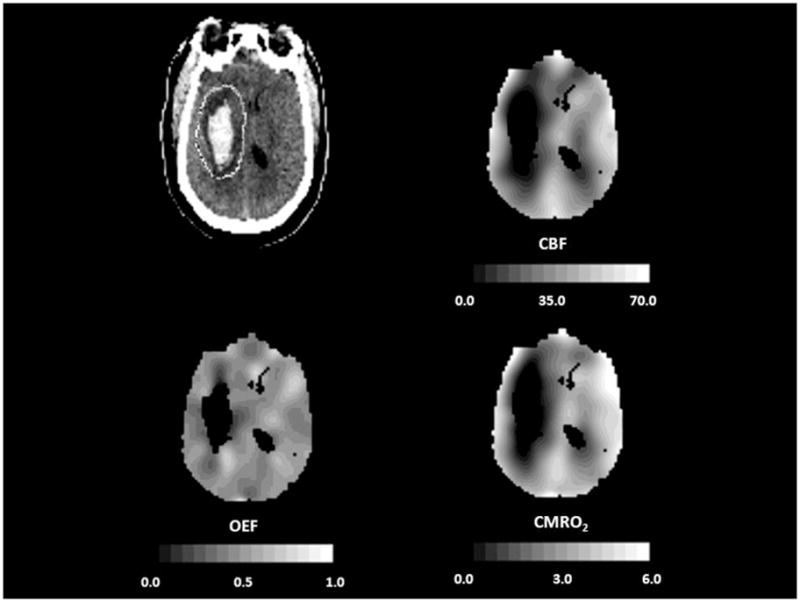
PET study of a 54-year old woman who developed left hemiparesis due to vasospasm 9 days after subarachnoid hemorrhage. Right hemispheric cerebral blood flow (CBF, mL 100g−1 min−1) is reduced more than the cerebral metabolic rate of oxygen (CMRO2, mL 100g−1 min−1) and oxygen extraction fraction (OEF) is increased, indicative of ischemia. In all images, the right side of the brain is on the reader’s right. Adapted from Powers WJ, Zazulia AR. The use of positron emission tomography in cerebrovascular disease. Neuroimaging Clin N Am 2003; 13: 741–758.
Similar articles
-
PET in Cerebrovascular Disease.PET Clin. 2010 Jan;5(1):83-106. doi: 10.1016/j.cpet.2009.12.007. Epub 2010 May 27. PET Clin. 2010. PMID: 27157485 Review.
-
The use of positron emission tomography in cerebrovascular disease.Neuroimaging Clin N Am. 2003 Nov;13(4):741-58. doi: 10.1016/s1052-5149(03)00091-1. Neuroimaging Clin N Am. 2003. PMID: 15024958 Review.
-
Cerebral hemodynamic and metabolic changes caused by brain retraction after aneurysmal subarachnoid hemorrhage.Neurosurgery. 1997 Mar;40(3):442-50; discussion 450-1. doi: 10.1097/00006123-199703000-00003. Neurosurgery. 1997. PMID: 9055282
-
The effect of remote ischemic conditioning on blood coagulation function and cerebral blood flow in patients with aneurysmal subarachnoid hemorrhage.Neurol Sci. 2020 Feb;41(2):335-340. doi: 10.1007/s10072-019-04057-1. Epub 2019 Oct 11. Neurol Sci. 2020. PMID: 31605259
-
Post-operative changes of cerebral circulation and metabolism in the acute stage of low-grade aneurysmal subarachnoid hemorrhage.Neurol Res. 2008 Sep;30(7):678-83. doi: 10.1179/174313208X291676. Epub 2008 Jul 15. Neurol Res. 2008. PMID: 18631432
Cited by
-
A dual-center validation of the PIRAMD scoring system for assessing the severity of ischemic Moyamoya disease.Quant Imaging Med Surg. 2023 Jul 1;13(7):4618-4632. doi: 10.21037/qims-22-1062. Epub 2023 Jun 15. Quant Imaging Med Surg. 2023. PMID: 37456328 Free PMC article.
-
Overview of Imaging Modalities in Stroke.Neurology. 2021 Nov 16;97(20 Suppl 2):S42-S51. doi: 10.1212/WNL.0000000000012794. Neurology. 2021. PMID: 34785603 Free PMC article. Review.
-
Cerebral oxygen extraction fraction (OEF): Comparison of challenge-free gradient echo QSM+qBOLD (QQ) with 15O PET in healthy adults.J Cereb Blood Flow Metab. 2021 Jul;41(7):1658-1668. doi: 10.1177/0271678X20973951. Epub 2020 Nov 27. J Cereb Blood Flow Metab. 2021. PMID: 33243071 Free PMC article.
-
Comparison of cerebral oxygen extraction fraction using ASE and TRUST methods in patients with sickle cell disease and healthy controls.J Cereb Blood Flow Metab. 2024 Aug;44(8):1404-1416. doi: 10.1177/0271678X241237072. Epub 2024 Mar 4. J Cereb Blood Flow Metab. 2024. PMID: 38436254 Free PMC article.
-
Neuroimaging biomarkers of neurodegenerative diseases and dementia.Semin Neurol. 2013 Sep;33(4):386-416. doi: 10.1055/s-0033-1359312. Epub 2013 Nov 14. Semin Neurol. 2013. PMID: 24234359 Free PMC article. Review.
References
-
- Derdeyn CP, Videen TO, Simmons NR, Yundt KD, Fritsch SM, Grubb RL, et al. Count-based PET method for predicting ischemic stroke in patients with symptomatic carotid arterial occlusion. Radiology. 1999;212(2):499–506. - PubMed
-
- Heiss WD, Kracht L, Grond M, Rudolf J, Bauer B, Wienhard K, et al. Early [(11)C]Flumazenil/H(2)O positron emission tomography predicts irreversible ischemic cortical damage in stroke patients receiving acute thrombolytic therapy. Stroke. 2000;31(2):366–369. - PubMed
-
- Siesjo BK. Brain Energy Metabolism. New York: John Wiley and Sons; 1978.
-
- Rossen R, Kabat H, Anderson JP. Acute arrest of cerebral circulation in man. Arch Neurol Psychiatry. 1943;50:510–528.
-
- Cohen PJ, Alexander SC, Smith TC, Reivich M, Wollman H. Effects of hypoxia and normocarbia on cerebral blood flow and metabolism in conscious man. J Appl Physiol. 1967;23(2):183–189. - PubMed
Grants and funding
LinkOut - more resources
Full Text Sources