. 2010 Jan;4(1):32-47.
doi: 10.1002/prca.200900124.

Shotgun proteomics identifies proteins specific for acute renal transplant rejection

Affiliations

Shotgun proteomics identifies proteins specific for acute renal transplant rejection

Tara K Sigdel et al. Proteomics Clin Appl. 2010 Jan.

Abstract

Purpose: Acute rejection (AR) remains the primary risk factor for renal transplant outcome; development of non-invasive diagnostic biomarkers for AR is an unmet need.

Experimental design: We used shotgun proteomics applying LC-MS/MS and ELISA to analyze a set of 92 urine samples, from patients with AR, stable grafts (STA), proteinuria (NS), and healthy controls.

Results: A total of 1446 urinary proteins (UP) were identified along with a number of nonspecific proteinuria-specific, renal transplantation specific and AR-specific proteins. Relative abundance of identified UP was measured by protein-level spectral counts adopting a weighted fold-change statistic, assigning increased weight for more frequently observed proteins. We have identified alterations in a number of specific UP in AR, primarily relating to MHC antigens, the complement cascade and extra-cellular matrix proteins. A subset of proteins (uromodulin, SERPINF1 and CD44), have been further cross-validated by ELISA in an independent set of urine samples, for significant differences in the abundance of these UP in AR.

Conclusions and clinical relevance: This label-free, semi-quantitative approach for sampling the urinary proteome in normal and disease states provides a robust and sensitive method for detection of UP for serial, non-invasive clinical monitoring for graft rejection after kidney transplantation.

Keywords: Acute rejection; Biomarkers; ELISA; Renal transplantation; Urinary proteomics.


Figures

Figure 1
Figure 1. Urinary proteins were identified from urine collected from healthy as well as renal patients with or without kidney transplant
Number of proteins identified in urine collected from renal transplant patients with biopsy proven acute rejection (AR), renal transplant patients with stable graft function (STA), healthy control (HC), and renal patients with nephrotic syndrome (NS).
Figure 2
Figure 2
Urinary proteins identified from different patients groups including the healthy controls (HC) were compared. [A] A Venn diagram to compare urinary proteins from healthy normal individuals identified in this study to the proteins identified by Adachi et al 12 and urinary proteins identified by 38. [B] A comparison of proteins identified in healthy urine (HC) and urine of nephrotic syndrome (NS). [C] A comparison of proteins identified in healthy urine (HC) and urine of renal transplant patients both stable graft (STA) and acute rejection (AR) combined. [D] A comparison of proteins identified in urine from stable graft (STA) to urine of acute rejection (AR).
Figure 3
Figure 3
A heat map demonstrating level of elevated proteins in AR compared to STA when compared to healthy urine and NS.
Figure 4
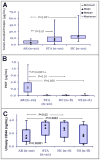
Figure 4. Verification of discovery of potential biomarker candidates by ELISA assay
Urinary protein level of three candidate proteins, THP, PEDF (SERPINF1), and CD44 were measured by ELISA using an independent set of samples from different phenotypes. (A) A decreased level of THP was observed in AR urine (n=20, mean concentration 5.50 μg/mL) when compared to STA urine (n=20, mean concentration 13.95 μg/mL) with P<0.01 and healthy control urine (n=20, mean concentration 19.80 μg/mL) with P<0.001. (B) An increased level of PEDF protein was observed in AR urine (n=20, mean concentration 0.40 μg/mL) when compared to STA urine (n=20, mean concentration 0.01 μg/mL) with P=0.0001, with healthy control urine (n=8, mean concentration 0.01 μg/mL) with P=0.02, and with nephrotic syndrome urine (n=6, mean concentration 0.02 μg/mL) with P=0.005. (C) A decreased level of CD44 protein was observed in AR urine (n=20, mean concentration 1.67 ng/mL) when compared to STA urine (n=20, mean concentration 12.57 ng/mL) with P<0.00001, with healthy control urine (n=6, mean concentration 11.76 ng/mL) with P<0.02, and with nephrotic syndrome urine (n=6, mean concentration 8.54 ng/mL) with P<0.0002. The boxes in the box plots are bounded by 75th and 25th percentiles of the data and the whiskers extend to the minimum and maximum values. As there are no statistically significant differences in urine osmolality between the samples groups (data not shown), the differences in concentration between groups are unlikely to be in part due to differences in water excretion, variably diluting or concentrating the markers.

Similar articles

Cited by

References

    1. Cravatt BF, Simon GM, Yates JR., 3rd The biological impact of mass-spectrometry-based proteomics. Nature. 2007;450(7172):991–1000. - PubMed
    1. de Hoog CL, Mann M. Proteomics. Annu Rev Genomics Hum Genet. 2004;5:267–93. - PubMed
    1. Veenstra TD, et al. Biomarkers: mining the biofluid proteome. Mol Cell Proteomics. 2005;4(4):409–18. - PubMed
    1. Laronga C, Drake RR. Proteomic approach to breast cancer. Cancer Control. 2007;14(4):360–8. - PubMed
    1. Hu S, Loo JA, Wong DT. Human body fluid proteome analysis. Proteomics. 2006;6(23):6326–53. - PMC - PubMed

Publication types